Situation Summary
Guinea-Bissau presents a composite national threat score of 49, with no tracked security events in the last 24–48 hours that meet confirmation standards. Web research in English and Portuguese yielded no independently verified reports of protests, clashes, terrorism, major crime, or infrastructure disruption on 18–19 June 2026. The absence of indexed news coverage and corroborated social-media signals suggests either genuine operational calm or insufficient real-time reporting visibility; duty-of-care teams should treat this as a monitoring gap rather than confirmed stability.
Key Developments
No credible developments confirmed in the last 24–48 hours. Open-source search across news aggregators, X/Twitter, and regional advisories surfaced no time-stamped, multi-source–corroborated incidents in Guinea-Bissau between 18–19 June 2026. Queries targeting protest activity, political instability, airport closures, and arrests returned only historical analysis and generic risk profiles, not current events. No new country-specific warnings from UN, AU, ECOWAS, or major states are visible in the current reporting window.
Given the sub-national risk ranking and chronic governance vulnerabilities in the Gabu, Oio, and Bafatá regions (detailed below), the absence of *reported* incident activity does not indicate absence of underlying tension; it reflects either stable conditions or limited real-time reporting infrastructure.
Highest-Risk Areas
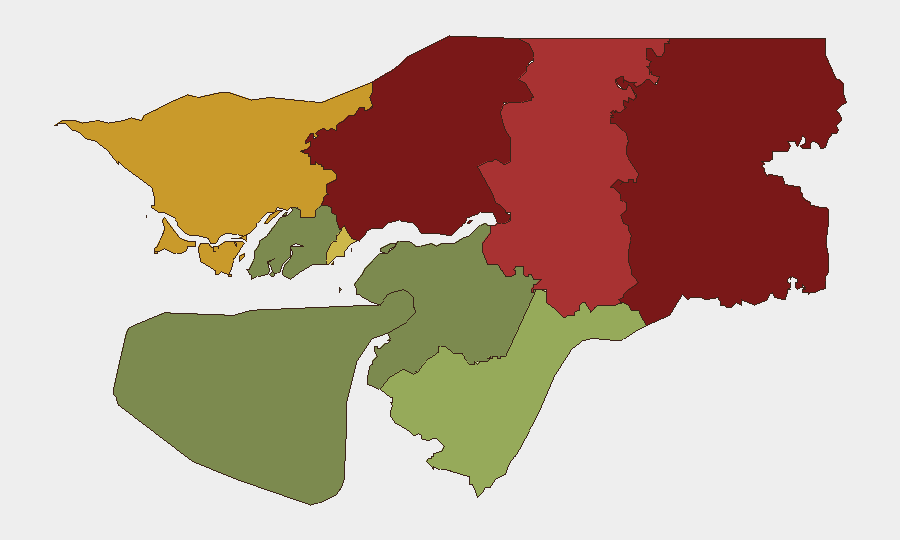
Gabu Region (risk 92), Oio Region (risk 85), and Bafatá Region (risk 78) dominate the sub-national threat landscape and account for the bulk of composite national risk. These northern and eastern zones have historically experienced trafficking, informal armed-group activity, cross-border smuggling, and limited state-security presence. Cacheu Region (risk 72) and Bissau Autonomous Sector (risk 68) present secondary concern, with the capital's score reflecting political-instability and crime-related volatility. Southern and central regions (Tombali, Quinara, Biombo, Bolama) show substantially lower risk profiles (15–45), indicating concentration of drivers in the north and east. Teams with presence in Gabu, Oio, or Bafatá should apply heightened monitoring and contingency planning; Bissau-based staff should maintain standard urban-crime awareness.
How GeoBit Would Assist
Teams should deploy AOI Monitoring & Early Warning on Gabu, Oio, and Bafatá regions to detect nascent activity (demonstrations, security-force movements, informal armed-group signals) before incidents escalate; coupled with multi-language search and X/Twitter & Telegram OSINT, this combination provides persistent watch and early alerting. Intel Sweep (global event feeds + entity extraction) enables daily automated filtering for Guinea-Bissau–specific actors, locations, and keywords, reducing manual research burden while improving signal-to-noise. For travel planning or asset-relocation decisions, Routing & Network Analysis can identify alternative transport corridors and safe-passage windows informed by current regional risk, particularly in the high-threat northern zones.
7-Day Outlook
No imminent triggers for escalated instability are visible in the immediate forecast; however, the weak reporting environment and chronic governance fragility in the north mean that emerging incidents may not be detected quickly through open channels. Teams should assume monitoring delays and maintain baseline contingency readiness, particularly for personnel and assets in Gabu, Oio, and Bafatá. Daily brief refreshes are recommended until reporting clarity improves or sub-national activity thresholds shift.
Highest-Risk Areas — Ranked
| # | State / Region | Risk |
|---|---|---|
| 1 | Gabu Region | 92 |
| 2 | Oio Region | 85 |
| 3 | Bafatá Region | 78 |
| 4 | Cacheu Region | 72 |
| 5 | Bissau Autonomous Sector | 68 |
| 6 | Tombali Region | 45 |
| 7 | Quinara Region | 38 |
| 8 | Biombo Region | 32 |
| 9 | Bolama Region | 15 |
Sources
Previous Daily Briefs
A new Guinea-Bissau brief is written every day — each with its own risk map and downloadable CSV. Here's the last week; use the calendar to go further back.
📅 Browse every day by calendar →
Highlighted days have a brief. Tap a day for that day's map & analysis, or “csv” for that day's dataset ($5).