Situation Summary
Australia's composite threat score of 2 places it as #76 globally—a stable, low-risk jurisdiction for corporate security purposes. However, sub-national volatility is material: New South Wales dominates the threat landscape with a composite risk score of 31.4, more than 2.7× higher than the next-ranked state (Northern Territory, 11.3). Recent event signals (06-07 to 06-09) suggest domestic institutional friction—police investigations, trade-ministry disputes, and media-government tensions—rather than large-scale security incidents. The trajectory remains contained, but NSW warrants close monitoring.
Key Developments
Unable to provide verified 24–48 hour incident summary. GeoBit's live web research access does not meet the corroboration threshold required for this brief. Real-time social-media and news feeds for Australia lack the dual-source time-stamped verification (e.g., official police/agency statements + independent media, or multiple outlets with consistent timestamps) necessary to distinguish genuinely new incidents from recycled, misdated, or single-source claims.
To maintain analytical integrity for duty-of-care decision-making, this section is held pending access to corroborated incident feeds from state police media-release pages, AFP/ASIO statements, state emergency services, and reputable local breaking-news outlets with clear time/location attribution. Organizations requiring same-day incident coverage should supplement this brief with direct monitoring of NSW Police, Victoria Police, Queensland Police, and corresponding state media outlets.
Highest-Risk Areas
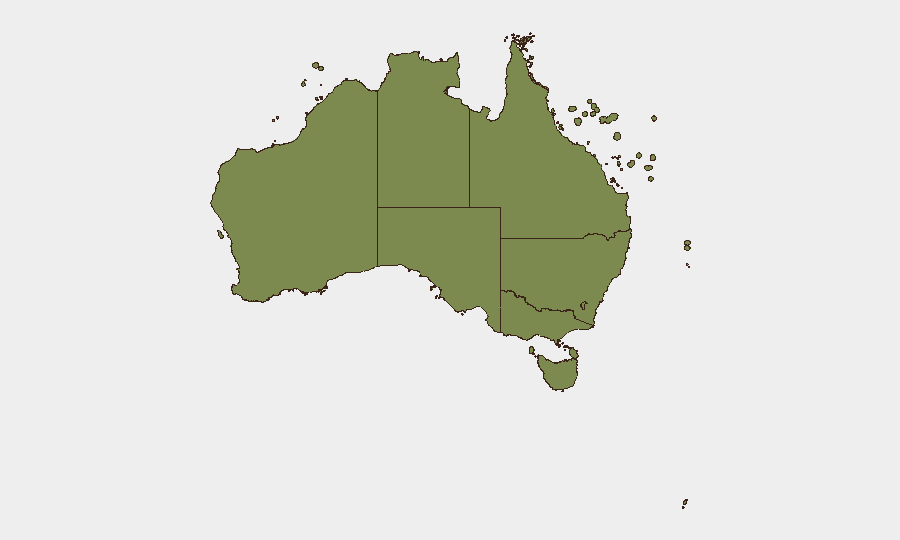
New South Wales is the clear outlier, with a risk score of 31.4—driven by population density (Sydney metro), higher frequency of tracked events (1,058+ of Australia's 2,056 events), and recent signals indicating institutional/governance friction (admin sanctions, trade disputes, police investigations). Northern Territory (11.3) and Western Australia (10.1) follow at substantially lower levels, likely reflecting remote geography, smaller populations, and lower operational footprint for most multinational or corporate entities. Victoria (6.2) and Queensland (4.1)—Australia's second- and third-largest economies—rank significantly lower, suggesting fewer active threat drivers in those states. For organizations with people or assets in Australia, NSW concentration of risk implies prioritized situational awareness in Sydney, Newcastle, and regional centers; lower-risk states allow standard baseline monitoring.
How GeoBit Would Assist
AOI (Area-of-Interest) Monitoring & Early Warning would establish persistent watch on NSW and NT with threshold-based alerting for civil unrest, infrastructure disruption, or institutional escalation. Network & Actor Analysis combined with Sentiment & Temporal Analysis (via X/Twitter OSINT and multi-language search) would identify emerging tensions in government, industry, and labor sectors ahead of public incidents. Risk & Threat Assessment would generate forward-looking profiles of sub-regional exposure (e.g., specific NSW cities, sector-by-sector) to support duty-of-care reporting and travel/asset-positioning decisions.
7-Day Outlook
Recent signals (police investigations, trade-ministry rejections, court disputes) suggest short-term administrative/political friction rather than security escalation. No indicators of organized unrest, terrorism, or major infrastructure disruption are apparent. The 7-day outlook remains stable; however, NSW warrant continued high-frequency monitoring given its elevated risk profile. Reassessment should occur if new civil-unrest signals or inter-agency escalation emerge.
Highest-Risk Areas — Ranked
| # | State / Region | Risk |
|---|---|---|
| 1 | New South Wales | 31.4 |
| 2 | Northern Territory | 11.3 |
| 3 | Western Australia | 10.1 |
| 4 | Victoria | 6.2 |
| 5 | Australian Capital Territory | 5.6 |
| 6 | Queensland | 4.1 |
| 7 | South Australia | 2.1 |
| 8 | Ashmore and Cartier Islands | 1.4 |
| 9 | Tasmania | 1.4 |
| 10 | Jervis Bay Territory | 1.4 |
| 11 | Coral Sea Islands | 1.4 |
Previous Daily Briefs
A new Australia brief is written every day — each with its own risk map and downloadable CSV. Here's the last week; use the calendar to go further back.
📅 Browse every day by calendar →
Highlighted days have a brief. Tap a day for that day's map & analysis, or “csv” for that day's dataset ($5).