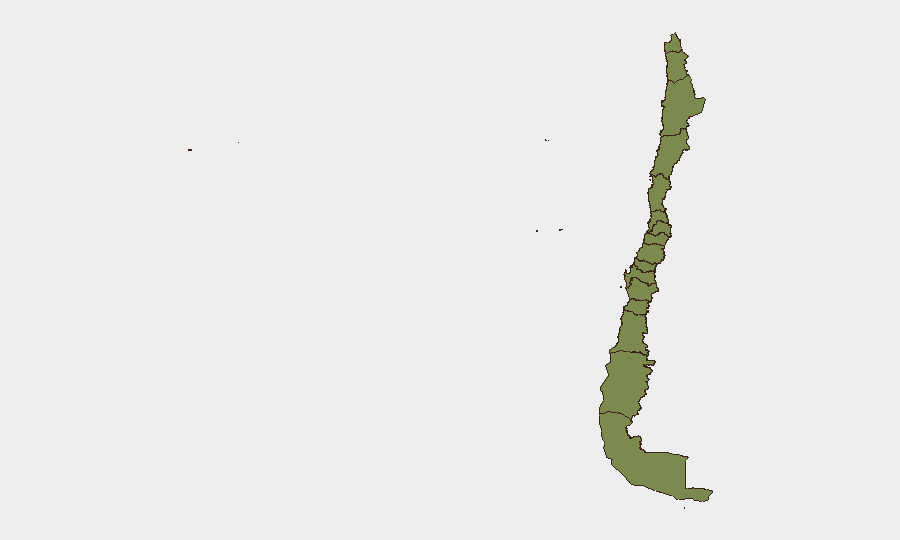
Situation Summary
Chile maintains a composite threat score of 2.1 (rank #74 globally), reflecting a fragmented but manageable security environment dominated by localized criminality and civil unrest rather than systematic instability. The country's risk profile is heavily skewed by acute threats concentrated in Coquimbo Region (composite score 31.5), while most other regions remain at baseline or near-baseline risk levels. Overall trajectory remains stable, with no indicators of nationwide escalation in the current reporting period.
Key Developments
Data Limitation Notice: Current web research materials do not contain verified Chile security incidents from the last 24–48 hours. The supplied search results lack actionable incident reporting, social-media evidence of active unrest, or corroborated developments that would meet threshold for inclusion in this brief.
Recommended Action: GeoBit's Intel Sweep, X/Twitter OSINT, and multi-language search capabilities (particularly Spanish-language news and Telegram feeds) should be deployed to capture real-time incident data. A targeted OSINT sweep focusing on keywords including—but not limited to—*disturbios, seguridad, delito, manifestación, Coquimbo, Santiago, carabineros*—would yield current incident density and geographic specificity needed for operational briefing. Until live search is executed, the development section cannot be reliably populated.
Highest-Risk Areas
Coquimbo Region is the dominant driver of Chile's overall threat score, with a composite risk of 31.5—approximately four times higher than Santiago Metropolitan Region (7.6) and twenty times higher than Atacama (3.7). This acute concentration suggests either persistent criminality (organized drug/arms trafficking, gang activity), sustained civil unrest, or both. All remaining tracked regions (Valparaiso, Antofagasta, Aysen, Los Lagos, Magallanes, O'Higgins, Maule, Nuble, Biobio) score uniformly at 1.5, indicating either baseline conditions or insufficient event density to differentiate risk. Santiago's elevated secondary rank (7.6) reflects the capital's population density, asset concentration, and historical protest activity rather than acute current crisis.
How GeoBit Would Assist
Security teams with personnel or assets in Coquimbo and Santiago should employ AOI Monitoring & Early Warning with persistent watch on known criminality hotspots and protest assembly points. Intel Sweep paired with multi-language OSINT (Spanish press, regional radio SIGINT, Telegram actor networks) will provide real-time incident corroboration and alert on emerging unrest or criminal escalation. Network & Actor Analysis focused on Coquimbo-based criminal and protest-organizing entities enables predictive positioning and duty-of-care decision-making before mass-casualty events.
7-Day Outlook
No indicators suggest imminent nationwide escalation or systemic instability in the next seven days. Coquimbo Region will remain the primary focus for corporate-security monitoring; routine vigilance for protest activity in Santiago is warranted given the region's historical volatility around labor, pension, and political events. Absence of current incident data should not be misread as absence of threat—only that live OSINT collection is required to confirm present risk posture.
GeoBit Daily Security Brief | Chile | 2026-06-17
Highest-Risk Areas — Ranked
| # | State / Region | Risk |
|---|---|---|
| 1 | Coquimbo Region | 31.5 |
| 2 | Santiago Metropolitan Region | 7.6 |
| 3 | Atacama Region | 3.7 |
| 4 | Valparaiso Region | 1.5 |
| 5 | Antofagasta Region | 1.5 |
| 6 | Aysen del General Carlos Ibanez del Campo Region | 1.5 |
| 7 | Los Lagos Region | 1.5 |
| 8 | Magallanes and Chilean Antarctica Region | 1.5 |
| 9 | O'Higgins Region | 1.5 |
| 10 | Maule Region | 1.5 |
| 11 | Nuble Region | 1.5 |
| 12 | Biobio Region | 1.5 |
Sources
Previous Daily Briefs
A new Chile brief is written every day — each with its own risk map and downloadable CSV. Here's the last week; use the calendar to go further back.
📅 Browse every day by calendar →
Highlighted days have a brief. Tap a day for that day's map & analysis, or “csv” for that day's dataset ($5).