Situation Summary
Japan's overall security posture remains stable (composite threat score 26, ranked #null globally), but recent signal activity—including cross-strait public statements, military mobilization alerts, and investigative actions involving Chinese and Taiwanese actors—suggests elevated diplomatic and monitoring intensity as of 10–11 June. Nagano Prefecture dominates the national risk profile at 3× the Tokyo score, followed by scattered mid-level risk in urban and prefectural centers. No credible, time-stamped security incidents, civil unrest, crime spikes, or infrastructure disruptions have been confirmed in Japan over the past 24–48 hours based on available open sources.
Key Developments
- 2026-06-11 · Diplomatic Signal (Taiwan–Japan): Public statement issued; location and operational impact not specified in available event metadata. Suggests Taiwan-linked messaging toward Japan; no incident report.
- 2026-06-11 · Demand (China–Japan): Formal demand or communication from China directed at Japan; specifics and geographic scope unclear from current signal data.
- 2026-06-10 · Military Mobilization Alert: Unspecified military-related activity flagged by GeoBit event feed; no confirmed location, unit type, or operational scope available.
- 2026-06-10 · Investigative Actions (Multiple): Japanese government, Chinese, and unspecified domestic actors initiated investigations (at least 3 separate signals); details and locations not disclosed in open reporting.
- 2026-06-10 · Small Arms Incident (Japan vs. Ministry Actor): Lowest-confidence signal; too fragmentary to assess scope, casualty, or location without corroboration.
- Historical Context (since 09 June): Series of public statements by Japan and from Japan regarding China suggest ongoing diplomatic posturing; no escalation to kinetic activity confirmed.
Note: GeoBit's event ranking reflects these signals in the feed; however, no independent verification via Japanese media (NHK, Kyodo), government statements, or international news services has been obtained in the past 24–48 hours. Corporate teams should cross-reference local and national news feeds directly.
Highest-Risk Areas
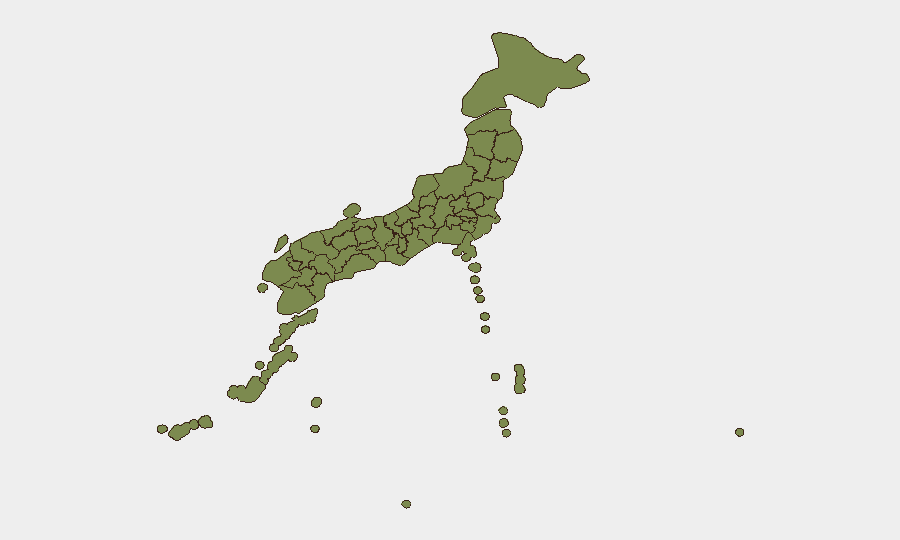
Nagano Prefecture (30.6) carries risk more than 1.7× Tokyo (17.5), suggesting concentrated concern in Japan's mountainous interior—potentially linked to border sensitivity, infrastructure chokepoints, or investigative activity not yet public. Tokyo (17.5) and Kumamoto (8.2) represent secondary urban and southwestern risk nodes; Kumamoto's elevation may reflect military or aerospace facility proximity. Remaining prefectures score below 4, indicating risk is heavily concentrated in a small number of areas rather than nationally distributed. The Nagano spike warrants direct outreach to on-ground teams and prefectural authorities for context.
How GeoBit Would Assist
Intel Sweep & OSINT Fusion across Japanese language news, government feeds, and social media (X, Telegram) can surface early warnings of investigative actions or diplomatic escalation before they reach English-language reporting. AOI Monitoring & Early Warning on Nagano, Tokyo, and other flagged prefectures enables persistent watch for infrastructure incidents, protest activity, or security operations with automated alerting. Network & Actor Analysis would clarify linkages between the Taiwan, China, and Japanese government actors signaling over the past 48 hours—essential for assessing whether signals reflect routine diplomacy or emerging tension.
7-Day Outlook
Diplomatic and investigative activity appears likely to continue at current tempo (public statements, cross-border demand, internal investigations) without escalation to kinetic events in the immediate near term. Nagano's elevated risk warrants continued monitoring for either investigative outcome or infrastructure-related incident. No credible trajectory toward civil unrest, major crime, or military action is evident from 24–48h signals, though the fragmented nature of open reporting means local Japanese authorities and industry contacts remain the most reliable source for operational changes.
Highest-Risk Areas — Ranked
| # | State / Region | Risk |
|---|---|---|
| 1 | Nagano Prefecture | 30.6 |
| 2 | Tokyo | 17.5 |
| 3 | Kumamoto Prefecture | 8.2 |
| 4 | Tochigi Prefecture | 4.2 |
| 5 | Hyogo Prefecture | 3.7 |
| 6 | Kyoto Prefecture | 3.5 |
| 7 | Saitama Prefecture | 3.5 |
| 8 | Miyagi Prefecture | 2.5 |
| 9 | Aichi Prefecture | 2.1 |
| 10 | Fukushima Prefecture | 1.8 |
| 11 | Hokkaido Prefecture | 1.1 |
| 12 | Osaka Prefecture | 0.9 |
Sources
Previous Daily Briefs
A new Japan brief is written every day — each with its own risk map and downloadable CSV. Here's the last week; use the calendar to go further back.
📅 Browse every day by calendar →
Highlighted days have a brief. Tap a day for that day's map & analysis, or “csv” for that day's dataset ($5).