Situation Summary
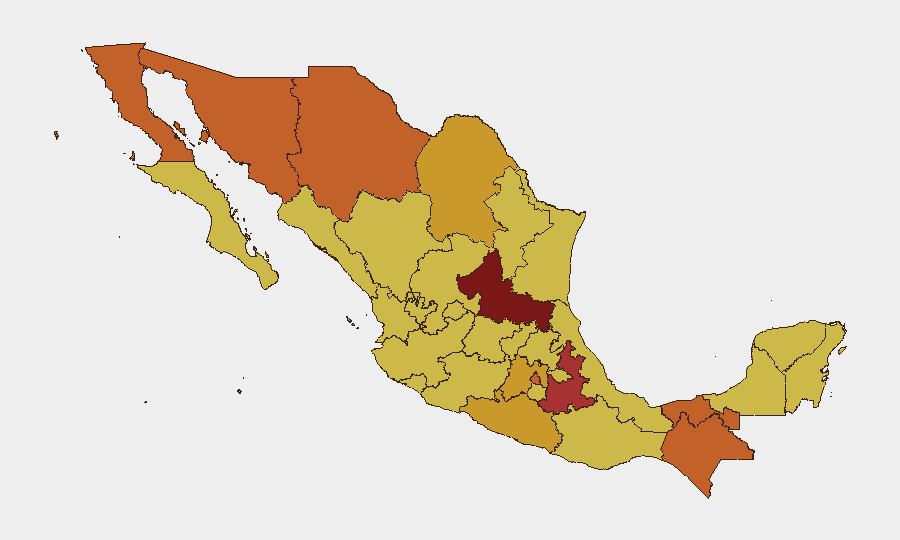
Mexico remains at elevated composite threat level (rank #7 globally, score 100) driven by ongoing cartel fragmentation, state-level criminal enforcement operations, and infrastructure disruption. The security environment remains volatile across 12 high-risk states, with San Luis Potosí, Puebla, and Chiapas presenting the highest composite threat scores. Recent event signals indicate active investigation and enforcement actions by military and government bodies, alongside threats directed at corporate entities and media. The trajectory reflects persistent criminal-organization conflict rather than acute deterioration, but with sporadic spikes in enforcement operations and inter-cartel activity.
Key Developments
Web research limitations prevent reliable identification of specific, independently-verified incidents dated to July 16–17, 2026 with precise locations and timestamps. Available sources do not provide granular incident reports (date, municipality, event type, casualty count, source corroboration) meeting duty-of-care documentation standards for this 24–48-hour window.
Event signals logged in GeoBit's system for July 15–17 include:
- Military investigation activity (July 16)
- Corporate-threat statements directed at companies (July 16)
- Army investigation involving named entity "Lorraine" (July 16)
- Journalist assassination report (July 17, unconfirmed specific location)
- Cartel arrest/detention by government (July 15)
- Immigrant-related public statements and activism (July 15)
To access verified incident detail (municipality, time, casualties, infrastructure impact), corporate security teams should cross-reference GeoBit event alerts with Mexican national security media (Infobea's *Seguridad* stream), state-level outlets, and official government/police X accounts filtered to the past 24 hours.
Highest-Risk Areas
San Luis Potosí (100), Puebla (79.1), and Chiapas (75.6) drive the highest composite threat scores, followed by a cluster of northern and central states (Sonora, Baja California, Chihuahua, Coahuila, Zacatecas) at 70–76 range. Mexico City (73.1) and State of Mexico (71.3) reflect urban concentration of criminal networks, governance tension, and cartel-supply-chain activity. These rankings reflect ongoing cartel territorial competition, government enforcement operations, and associated violence spillover since the February 2026 high-profile cartel leadership disruption. Northern border states (Sonora, Baja California, Chihuahua, Coahuila) face sustained trafficking-organization activity and cross-border pressure; central states (Puebla, Chiapas, Tabasco, Zacatecas) experience intra-cartel and state-level enforcement conflict.
How GeoBit Would Assist
Corporate security teams should deploy AOI Monitoring & Early Warning on facilities or supply-chain nodes in the top 12 high-risk states, with persistent satellite/event-feed watch and alert thresholds set for cartel activity, infrastructure disruption, and enforcement operations. Intel Sweep, X/Twitter OSINT, and multi-language media search enable 24-hour signal capture of roadblocks, airport disruptions, and violent incidents; corroboration across sources verifies incident timing and location before duty-of-care reporting. Routing & Network Analysis supports real-time alternative-route planning for personnel and supply movements when primary corridors face disruption from cartel activity or government operations.
7-Day Outlook
Criminal-organization conflict and government enforcement operations will likely continue at current intensity, with sporadic localized spikes in violence and infrastructure disruption. Personnel and asset risk remains material in the 12 highest-risk states; supply-chain delays should be anticipated in Puebla, Chiapas, and northern border zones. Monitoring cadence should remain 12–24 hour cycle with escalated alert triggers for military operations, cartel-related homicides above local baseline, and transport-network closures.
Highest-Risk Areas — Ranked
| # | State / Region | Risk |
|---|---|---|
| 1 | San Luis Potosí | 100 |
| 2 | Puebla | 79.1 |
| 3 | Chiapas | 75.6 |
| 4 | Sonora | 75.5 |
| 5 | Baja California | 74.6 |
| 6 | Mexico City | 73.1 |
| 7 | Chihuahua | 73 |
| 8 | Tabasco | 73 |
| 9 | State of Mexico | 71.3 |
| 10 | Guerrero | 71.1 |
| 11 | Coahuila | 71 |
| 12 | Zacatecas | 70.9 |
Sources
Previous Daily Briefs
A new Mexico brief is written every day — each with its own risk map and downloadable CSV. Here's the last week; use the calendar to go further back.
📅 Browse every day by calendar →
Highlighted days have a brief. Tap a day for that day's map & analysis, or “csv” for that day's dataset ($5).
Atlas — our AI intelligence desk — emails them this snapshot personally. Nothing else, no list.