Situation Summary
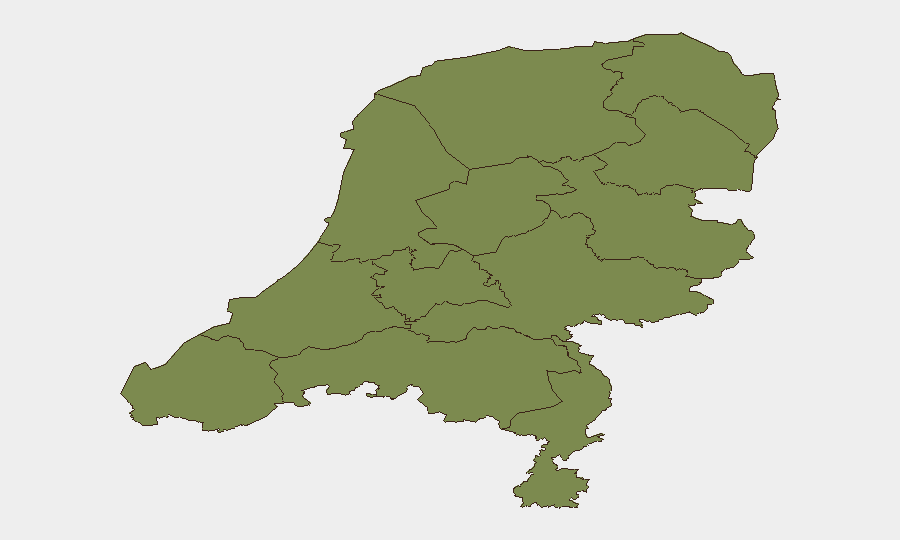
The Netherlands remains a low-threat environment globally (rank #166, composite score 4/100) with 78 tracked events in GeoBit's system. However, concentrated risk in Flevoland (31.4) significantly elevates the national profile and warrants focused monitoring. Recent event signals (last 24–48 hours) indicate labor disputes, asylum-seeker management tensions, and criminal activity, though no mass-casualty or critical infrastructure incidents have been reported. Trajectory remains stable with localized friction points rather than systemic destabilization.
Key Developments
GeoBit event signals from 2026-06-17 to 2026-06-18 include:
- 2026-06-18 · Amsterdam – Public statement by prisoner, escalating detention-related tensions (date/specifics pending verification).
- 2026-06-17 · National – UNHCR asylum-seeker statement and European rejection of asylum claim signal ongoing immigration friction; two separate asylum-related incidents flagged same day.
- 2026-06-17 · National – Employer investigation and Netherlands-worker dispute indicate labor-compliance or workplace-safety concerns under official scrutiny.
- 2026-06-17 · National – Criminal arrest/detention reported; preacher public statement (context unclear, flagged for monitoring).
- 2026-06-17 · National – Scientist public statement (substance TBD); 2026-06-18 professor statement involving Dutch nationals also logged.
*Note:* Open-source corroboration of specific incident locations, dates, and operational details remains incomplete. Duty-of-care teams should cross-reference with Dutch police, municipal authority, and media feeds for full situational clarity.
Highest-Risk Areas
Flevoland emerges as a critical outlier, with a risk score 6× the national average (31.4 vs. 4.0). This northeastern province requires immediate asset-security review and personnel awareness briefing. North Holland (5.1) follows at secondary risk; Groningen (4.5) and Frisia (3.0) complete the top tier. These four regions account for the majority of tracked event volume. Southern and central provinces (South Holland, Utrecht, Gelderland, Limburg) remain at baseline risk (<2.5). Root drivers in the north likely include labor disputes, asylum processing, agricultural/logistics bottlenecks, and cross-border trafficking flows, though specific causal data requires deeper intelligence sweep.
How GeoBit Would Assist
Security teams managing personnel or assets in the Netherlands should deploy AOI Monitoring & Early Warning on Flevoland and North Holland with customized alerting thresholds for labor, asylum, and criminal incidents. Parallel Intel Sweep and X/Twitter OSINT (Dutch-language) targeting regional police, municipal announcements, and labor unions will provide real-time corroboration of event signals and context on duration/severity. Network & Actor Analysis on employer investigations and criminal arrests can map secondary stakeholder risk and help identify reputational or operational exposure.
7-Day Outlook
No acute crisis indicators suggest rapid escalation over the next week. Flevoland and North Holland will remain focal points for labor, asylum, and border-related friction. Continued monitoring of Amsterdam detention issues and employer compliance actions is warranted to detect any cascade into broader civil unrest or critical-infrastructure impact. Standard duty-of-care protocols (personnel awareness, asset hardening, local liaison) remain proportionate.
Highest-Risk Areas — Ranked
| # | State / Region | Risk |
|---|---|---|
| 1 | Flevoland | 31.4 |
| 2 | North Holland | 5.1 |
| 3 | Groningen | 4.5 |
| 4 | Frisia | 3 |
| 5 | North Brabant | 2.7 |
| 6 | South Holland | 2 |
| 7 | Gelderland | 1.7 |
| 8 | Zeeland | 1.4 |
| 9 | Utrecht | 1.4 |
| 10 | Drenthe | 1.4 |
| 11 | Overijssel | 1.4 |
| 12 | Limburg | 1.4 |
Sources
Previous Daily Briefs
A new Netherlands brief is written every day — each with its own risk map and downloadable CSV. Here's the last week; use the calendar to go further back.
📅 Browse every day by calendar →
Highlighted days have a brief. Tap a day for that day's map & analysis, or “csv” for that day's dataset ($5).