Situation Summary
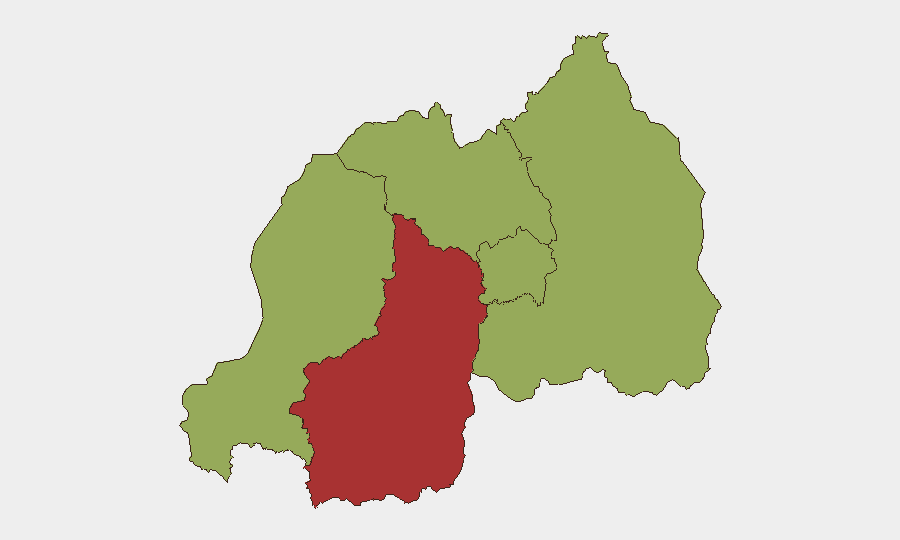
Rwanda remains a stable, middle-income country with composite threat score 67.5 (rank #31 globally) and no confirmed security incidents in the past 24–48 hours. However, regional dynamics—including Kenya–Rwanda diplomatic friction (as of 2026-06-09), a military/police power demonstration by Congo on the border (2026-06-11), and persistent Marburg virus disease activity—warrant continuous monitoring. The Southern Province carries significantly elevated risk (77.2) compared to other zones, while Kigali City and three provincial zones remain at moderate threat levels (47.2 each).
Key Developments
- 2026-06-11 · Congo–Rwanda Border: Military/police power show reported by Congo on Rwanda's border; no casualties or incursions confirmed, but signals heightened regional tension and warrant close watch on Congolese force posture.
- 2026-06-10 · Kigali (presumed): Canadian national arrested or detained by Rwandan authorities; circumstances and charges unclear; corporate teams with Canadian staff should confirm status and consular access.
- 2026-06-09 · Kigali/Nairobi: Rwanda–Kenya diplomatic relations show signs of strain; no border disruption reported, but reduced bilateral engagement may affect cross-border travel, commerce, and coordination.
- Recent · Health Threat (ongoing): Marburg virus disease activity continues in Rwanda; epidemiological details sparse in available reporting, but poses occupational risk to healthcare workers and potential containment-related movement restrictions.
- No verified civil unrest, infrastructure failure, or airport/border disruptions detected in the past 24–48 hours.
Highest-Risk Areas
Southern Province (77.2) stands as Rwanda's highest-risk zone—more than 60% higher than any other region—and should be the focus of duty-of-care protocols for personnel or asset deployment. Western, Northern, Eastern Provinces, and Kigali City (all 47.2) are at equivalent, moderate threat levels. The concentration of risk in the South suggests either historical armed-group activity, cross-border spillover from Burundi or DRC, or localized criminality; corporate teams should confirm the drivers of this disparity with GeoBit's conflict and border-analysis tools before committing staff or operations to Southern Province locations.
How GeoBit Would Assist
Intel Sweep & OSINT Fusion: Real-time monitoring of Telegram, X, and regional news feeds can surface emerging incidents (arrests, civil unrest, health alerts) before they reach mainstream media, enabling faster duty-of-care decision-making.
AOI Monitoring & Early Warning: Persistent area-of-interest watches on Southern Province, Kigali, and the Congo–Rwanda border can alert teams to crowd movements, military activity, or checkpoint changes 24–48 hours ahead of public announcements.
Conflict & Military + Border Analysis: Mapping Congolese force posture, historical M23/armed-group patterns, and Kenya–Rwanda friction points clarifies which provinces carry structural, long-term risk versus episodic threat.
Network & Actor Analysis: Identifying arrest patterns, detention facility locations, and consular/legal resources can accelerate response if corporate staff are detained.
7-Day Outlook
No imminent security degradation is forecast, provided the Congo border activity remains a demonstration and Kenya–Rwanda tensions do not escalate into travel bans or checkpoint harassment. Marburg disease surveillance should be monitored for any expansion or movement-restriction orders. Corporate teams should maintain posture on the Southern Province risk drivers and confirm whether the Canada detention is routine or signals broader instability.
Highest-Risk Areas — Ranked
| # | State / Region | Risk |
|---|---|---|
| 1 | Southern Province | 77.2 |
| 2 | Western Province | 47.2 |
| 3 | Northern Province | 47.2 |
| 4 | Kigali City | 47.2 |
| 5 | Eastern Province | 47.2 |
Sources
Previous Daily Briefs
A new Rwanda brief is written every day — each with its own risk map and downloadable CSV. Here's the last week; use the calendar to go further back.
📅 Browse every day by calendar →
Highlighted days have a brief. Tap a day for that day's map & analysis, or “csv” for that day's dataset ($5).