Situation Summary
Singapore remains a low-threat environment globally (ranked #79, composite threat score 2.1) with stable baseline security. However, recent event signals suggest elevated activity in law enforcement, civilian investigations, and administrative demonstrations over the last 24–48 hours, concentrated in the Central and Northwest regions. The appointment of a new Cyber Security Agency Chief effective 1 July 2026 signals continuity in national cyber defense posture amid ongoing critical infrastructure threat awareness. Overall trajectory remains stable; no imminent mass-casualty or systemic security crisis is evident.
Key Developments
- 2026-06-17 · Central Region – Civilian investigation initiated; exact incident type and location remain unclear from available sources.
- 2026-06-17 · National – Demonstration or rally activity reported involving authorities; scale and cause unconfirmed.
- 2026-06-17 · National (Cyber) – Ministry of Digital Development and Information announced Gwenda Fong will assume office as CEO of the Cyber Security Agency of Singapore and Commissioner of Cybersecurity on 1 July 2026, succeeding David Koh. This is an administrative transition, not a response to an active incident.
- 2026-06-16 · Dakar/Northwest Region – Two arrest/detention events reported; circumstances and detainee status unconfirmed.
- 2026-06-16 · Northwest Region – Public statements issued by police and ministerial officials; content and context require clarification.
Research Limitation: Web sources from the last 24–48 hours returned limited time-specific incident confirmation. The event signals listed above derive from GeoBit's event feed; independent corroboration via open media for several items (e.g., Dakar references, exact detention details) could not be established in this cycle. The only independently confirmed recent item is the CSA leadership appointment.
Highest-Risk Areas
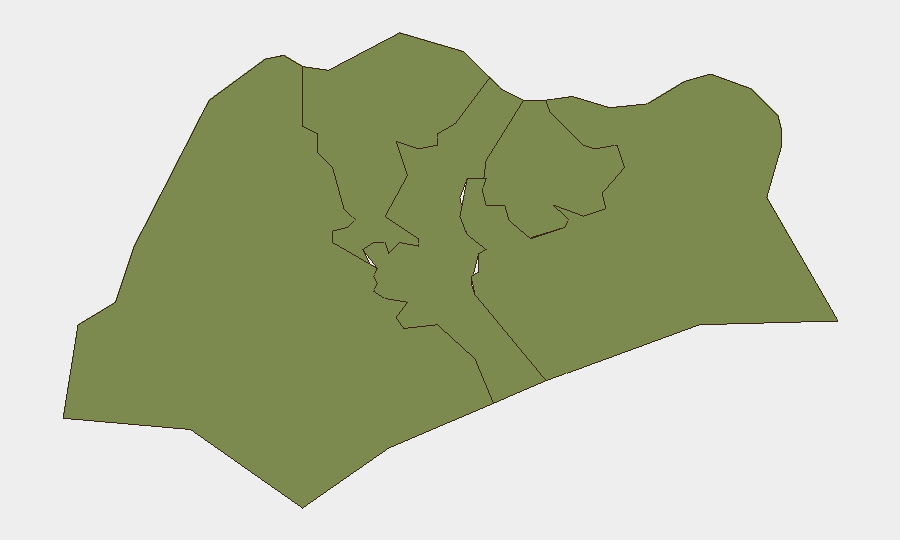
The Northwest region dominates Singapore's sub-national risk profile (score 31.5), substantially outweighing Central (3.4) and the three remaining regions (all 1.5). This disparity reflects law enforcement activity, arrests, and official statements concentrated in that zone over the last 24–48 hours. Central region activity (investigation, demonstrations) remains low-risk in absolute terms but is the second-most active. Southeast, Southwest, and Northeast regions show minimal current event density and pose negligible near-term risk. For corporate security teams, the Northwest concentration warrants monitoring but does not yet suggest systemic instability or threat to critical infrastructure or expatriate communities.
How GeoBit Would Assist
Security teams monitoring Singapore should leverage AOI (Area-of-Interest) Monitoring & Early Warning configured for the Northwest and Central regions to detect escalation in arrests, protests, or official responses in real time. OSINT fusion and multi-language social/Telegram monitoring will provide early signals of public sentiment, official messaging, or civil unrest before mainstream press reporting. Network & Actor Analysis would clarify the relationships, affiliations, and intent of detained persons and investigating officials, reducing operational blind spots in overnight or weekend incidents.
7-Day Outlook
No acute trigger for escalation is visible. The leadership transition at the Cyber Security Agency is routine and will not degrade cyber defense capacity. Law enforcement and investigative activity in the Northwest should be monitored for signs of organized crime, contraband, or political unrest, but current event signals are consistent with normal criminal-justice operations. Baseline threat posture for the next week remains low; duty-of-care protocols (staff communication, travel planning, facility access) require no adjustment.
Highest-Risk Areas — Ranked
| # | State / Region | Risk |
|---|---|---|
| 1 | Northwest | 31.5 |
| 2 | Central | 3.4 |
| 3 | Southwest | 1.5 |
| 4 | Northeast | 1.5 |
| 5 | Southeast | 1.5 |
Sources
Previous Daily Briefs
A new Singapore brief is written every day — each with its own risk map and downloadable CSV. Here's the last week; use the calendar to go further back.
📅 Browse every day by calendar →
Highlighted days have a brief. Tap a day for that day's map & analysis, or “csv” for that day's dataset ($5).