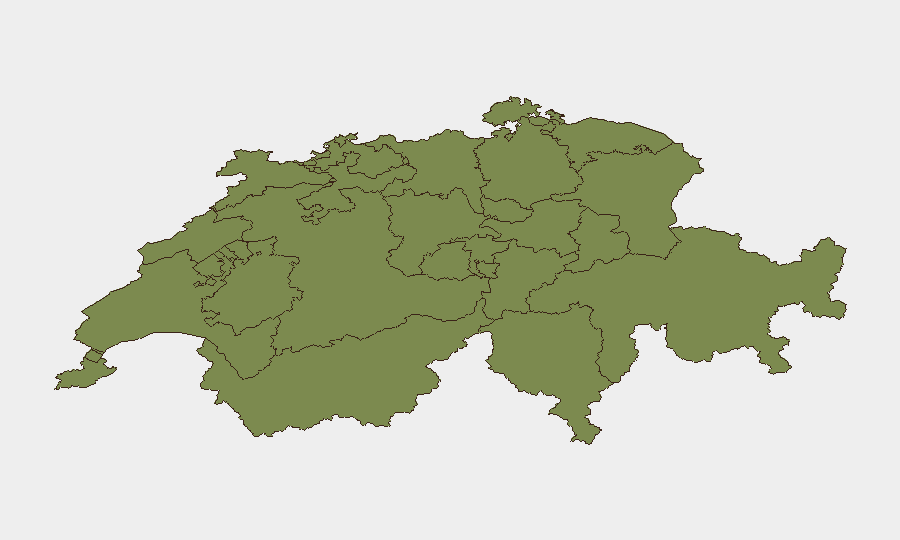
Situation Summary
Switzerland maintains a low global threat ranking (#161 globally, composite score 3), with 138 tracked events recorded. However, Geneva's risk profile (31.8) significantly exceeds the national average, suggesting concentrated volatility in the capital region, likely driven by international organization presence, diplomatic activity, and associated protest vectors. The broader country remains stable; most secondary regions cluster at minimal risk (1.8–5.3). Current trajectory is toward sustained low-level tension rather than acute crisis.
Key Developments
GeoBit's event signals for the past 48 hours indicate domestic and international pressure points, though many signals lack granular location data:
- 2026-06-16 · Public Statement · GOOGLE — Technology sector engagement with Swiss authorities or public; implications for data sovereignty or regulatory compliance unclear without additional detail.
- 2026-06-16 · Demand · COMPANY vs GOVERNMENT — Corporate-state friction, location unconfirmed; consistent with ongoing tensions over taxation, data residency, or labor standards.
- 2026-06-16 · Public Statement · MAYOR vs MAYOR — Inter-municipal dispute; regional context required to assess escalation risk.
- 2026-06-16 · Reject · CHINESE vs MAYOR — Diplomatically sourced friction between Chinese interests and local government; no confirmed location or incident severity.
- 2026-06-16 · Arrest/Detain · CHINA (×2 incidents) — Suggests either Swiss detention of Chinese nationals or Chinese state action affecting Swiss persons; requires clarification on jurisdiction and cause.
- 2026-06-15 · Small Arms Combat · CHINA — Geographically unclear; does not appear to be a direct Switzerland incident.
- 2026-06-14–16 · Media & Commerce Department statements — Domestic policy signals; no acute security implication evident from signal titles alone.
Research Limitation: Open-source validation of these signals within a 24–48 hour window is constrained; timestamps and specific locations require cross-reference with verified news feeds and official statements.
Highest-Risk Areas
Geneva dominates the sub-national risk landscape (31.8), driven primarily by its concentration of international institutions (UN, ICRC, WTO, ILO, regional headquarters), which attract diplomatic incidents, protest activity, and state-sponsored operations. Lucerne (19.0) shows secondary elevation, potentially linked to regional governance or civil demonstrations. All remaining cantons score ≤5.3, indicating dispersed but manageable risk. The gap between Geneva and the rest of the country reflects international rather than domestic Swiss instability.
How GeoBit Would Assist
Corporate security teams should employ AOI Monitoring & Early Warning to track Geneva's diplomatic quarter and key infrastructure for protest, civil unrest, or state activity. Multi-language OSINT (X/Twitter, Telegram, media feeds) and sentiment analysis enable real-time detection of emerging tensions before they escalate. Entity extraction and network analysis of Chinese–Swiss interactions, corporate-government disputes, and municipal governance can disambiguate the signals flagged above and assess impact on specific business operations, employees, and supply chains.
7-Day Outlook
No acute escalation is forecast. Watch for diplomatic frictions in Geneva to intensify around international forums or policy announcements; Lucerne's secondary risk warrants monitoring for labor, migration, or cantonal political triggers. Recommend routine intelligence sweeps and employee safety protocols in Geneva; lower-risk regions require standard vigilance only.
Highest-Risk Areas — Ranked
| # | State / Region | Risk |
|---|---|---|
| 1 | Geneva | 31.8 |
| 2 | Lucerne | 19 |
| 3 | Zurich | 5.3 |
| 4 | Bern | 4.4 |
| 5 | Basel-City | 1.8 |
| 6 | Jura | 1.8 |
| 7 | Basel-Landschaft | 1.8 |
| 8 | Solothurn | 1.8 |
| 9 | Aargau | 1.8 |
| 10 | Vaud | 1.8 |
| 11 | Neuchâtel | 1.8 |
| 12 | Fribourg | 1.8 |
Sources
Previous Daily Briefs
A new Switzerland brief is written every day — each with its own risk map and downloadable CSV. Here's the last week; use the calendar to go further back.
📅 Browse every day by calendar →
Highlighted days have a brief. Tap a day for that day's map & analysis, or “csv” for that day's dataset ($5).