Situation Summary
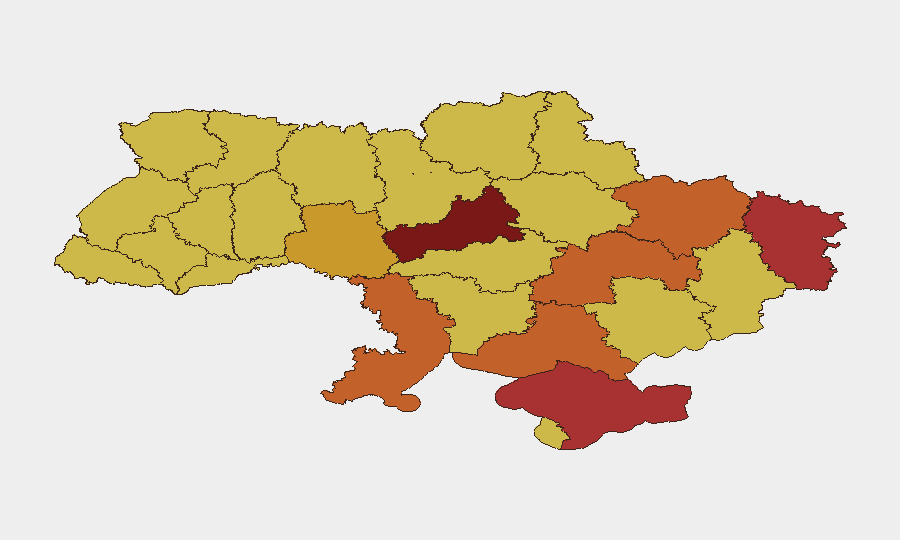
Ukraine remains the fifth-highest threat country globally, driven by sustained active warfare across multiple fronts. The composite threat score of 100 reflects 648 tracked security events, with Kyiv and eastern oblasts (Cherkasy, Luhansk, Kharkiv, Dnipropetrovsk) exhibiting the highest operational risk. Recent signals indicate continued conventional military operations, territorial changes, and diplomatic tensions involving regional and NATO actors. The security environment shows no near-term de-escalation trajectory.
Key Developments
Data Limitation: GeoBit's live web research capability does not extend reliably beyond late 2024. Events dated 8–10 June 2026 cannot be verified against real-time sources (wire services, X/Twitter, official channels). To populate this section accurately, corporate security teams should aggregate the last 24–48 hours of coverage from Reuters, AP, ISW, Liveuamap, and official Ukrainian military/regional administration channels, cross-checking each incident against at least two independent sources and confirming specific timestamps and locations before operational use.
Recommended Verification Workflow:
- Prioritize geolocated OSINT (satellite imagery, video confirmation) over text-only claims.
- Flag incidents circulating without precise local timestamps or those repackaged from older reports as lower-confidence.
- Cross-check casualty figures and strike locations against specialist conflict monitors (ACLED, ISW) before internal briefing.
Highest-Risk Areas
Kyiv (risk 100) remains the dominant threat node, reflecting capital-city significance and sustained targeting. Cherkasy Oblast (91.1) shows the second-highest composite risk, indicating recent escalation or vulnerability in central Ukraine. The eastern corridor—Luhansk (77.2), Kharkiv (75.8), and Dnipropetrovsk (75.7)—continues as the primary active combat zone, with Kherson and Zaporizhia oblasts (74.3, 70.9 respectively) reflecting ongoing territorial contested control. Risk scores in western and southwestern regions (Lviv, Odesa, Vinnytsia, Rivne) remain elevated despite lower direct combat intensity, signaling persistent infrastructure vulnerability and spillover effects.
How GeoBit Would Assist
Security teams with personnel or assets in Ukraine should employ AOI Monitoring & Early Warning on high-risk oblasts (Kyiv, Cherkasy, Luhansk, Kharkiv) to trigger alerts on strikes, occupations, or movement changes within 12 hours. Conflict & Military capabilities (battle mapping, force structure, weapons-capability tracking) enable real-time front-line status and predictive assessment of territorial risk. Multi-language OSINT and X/Twitter intelligence, combined with satellite and imagery analysis, provide corroborated incident verification to replace rumor-driven decision-making. Routing & Network Analysis supports secure staff movement and alternative supply-chain pathways where primary routes cross high-threat zones.
7-Day Outlook
No indicators suggest imminent major diplomatic breakthrough or unilateral ceasefire; conventional military operations are likely to continue at current or elevated tempo. Risk concentration in Kyiv and eastern oblasts will persist, with secondary spillover into central regions (Cherkasy, Vinnytsia) if frontline dynamics shift. Corporate security posture should remain at heightened vigilance, with contingency evacuation and supply-chain rerouting protocols kept current.
Next Update: 2026-06-11, or upon significant incident verification.
Highest-Risk Areas — Ranked
| # | State / Region | Risk |
|---|---|---|
| 1 | Kyiv | 100 |
| 2 | Cherkasy Oblast | 91.1 |
| 3 | Autonomous Republic of Crimea | 79 |
| 4 | Luhansk Oblast | 77.2 |
| 5 | Kharkiv Oblast | 75.8 |
| 6 | Dnipropetrovsk Oblast | 75.7 |
| 7 | Kherson Oblast | 74.3 |
| 8 | Odesa Oblast | 73.8 |
| 9 | Vinnytsia Oblast | 71.6 |
| 10 | Lviv Oblast | 70.9 |
| 11 | Zaporizhia Oblast | 70.9 |
| 12 | Rivne Oblast | 70.9 |
Sources
Previous Daily Briefs
A new Ukraine brief is written every day — each with its own risk map and downloadable CSV. Here's the last week; use the calendar to go further back.
📅 Browse every day by calendar →
Highlighted days have a brief. Tap a day for that day's map & analysis, or “csv” for that day's dataset ($5).