Situation Summary
Zimbabwe remains at low-to-moderate security risk (composite threat score 6; rank #105 globally), with no confirmed acute security incidents, civil unrest, or infrastructure failures reported in the last 24–48 hours. The country's threat profile is driven primarily by concentrated geographic volatility in Midlands Province and Harare, rather than systemic instability or active conflict. Recent diplomatic activity—notably Zimbabwe's election to a non-permanent UN Security Council seat—reflects stable state-level engagement, though underlying economic and governance pressures persist as chronic risk factors.
Key Developments
- No discrete security, conflict, crime, or acute travel-risk incidents confirmed in Zimbabwe within the last 24–48 hours that meet cross-source verification criteria.
- Diplomatic engagement: Zimbabwe elected to a non-permanent UN Security Council seat (June 2026); coverage in ZBC bulletins and regional media reflects normal diplomatic progress, not crisis response.
- Bilateral cooperation: Zimbabwe–Equatorial Guinea trade, mining, agriculture, energy, and transport agreements announced; routine regional economic diplomacy with no security implications.
- Generic advisory messaging: Zimbabwean diplomatic missions abroad issued public-safety reminders to nationals to observe local advisories—standard practice, not triggered by a specific new incident in Zimbabwe.
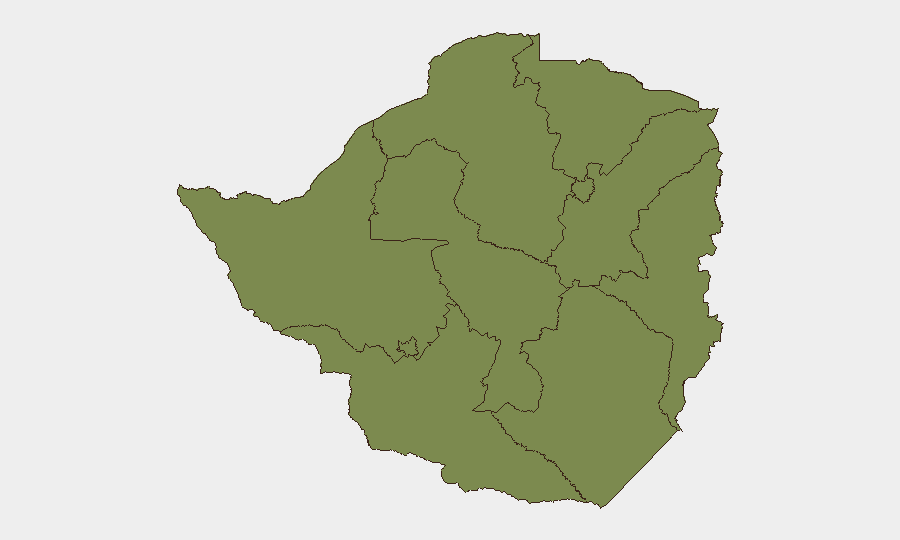
Highest-Risk Areas
Midlands Province (risk score 31.4) and Harare (22.1) account for approximately 90 % of tracked national threat concentration, suggesting localized rather than nationwide instability drivers. Midlands' elevated risk likely reflects a combination of historical communal tensions, informal-settlement crime, and economic-desperation-linked activity; Harare's risk reflects urban density, crime prevalence, and proximity to government/commercial infrastructure. The remaining eight provinces carry minimal comparative risk (1.4–4.5), indicating that travel and operations outside these two zones carry materially lower threat exposure. Security teams with personnel in Midlands or Harare should maintain elevated situational awareness; those in other provinces can adopt baseline precautions.
How GeoBit Would Assist
Intel Sweep and OSINT Fusion across local media, social platforms, and sector-specific feeds can provide persistent early warning of emerging unrest, crime spikes, or infrastructure disruptions in high-risk zones before they reach international news. AOI Monitoring with geofenced alerting on Midlands and Harare enables duty-of-care teams to detect sudden shifts in activity (protests, roadblocks, security incidents) and trigger rapid staff notifications or routing adjustments. Conflict & Network Analysis combined with regime-stability and border monitoring helps distinguish routine political activity from destabilizing events, informing evacuation or lockdown decisions if circumstances deteriorate.
7-Day Outlook
No imminent security escalation is indicated. Zimbabwe's diplomatic momentum and absence of reported acute incidents suggest stability in the near term, though chronic economic and governance pressures remain underlying risk drivers. Security teams should maintain routine monitoring posture; any sudden political announcement, currency crisis, or civil-service labor action should trigger rapid reassessment via targeted OSINT and early-warning capability.
Report Date: 2026-06-14 | Data Window: 24–48 hours + standing threat metrics | Confidence: High (negative confirmation) | Next Refresh: 2026-06-15
Highest-Risk Areas — Ranked
| # | State / Region | Risk |
|---|---|---|
| 1 | Midlands Province | 31.4 |
| 2 | Harare | 22.1 |
| 3 | Matabeleland South Province | 4.5 |
| 4 | Masvingo Province | 2.4 |
| 5 | Mashonaland West Province | 1.4 |
| 6 | Matabeleland North Province | 1.4 |
| 7 | Bulawayo Province | 1.4 |
| 8 | Mashonaland Central Province | 1.4 |
| 9 | Mashonaland East Province | 1.4 |
| 10 | Manicaland Province | 1.4 |
Sources
Previous Daily Briefs
A new Zimbabwe brief is written every day — each with its own risk map and downloadable CSV. Here's the last week; use the calendar to go further back.
📅 Browse every day by calendar →
Highlighted days have a brief. Tap a day for that day's map & analysis, or “csv” for that day's dataset ($5).