Situation Summary
Australia's composite threat score of 3.7 ranks it #56 globally, reflecting a volatile 24–48-hour period marked by conflicting event signals (military force notation, arrests, public statements, and political tension) concentrated in New South Wales and the Northern Territory. The high frequency of "Conventional Military Force" events attributed to state actors, political figures, and institutional entities on 2026-06-08 suggests either data-collection anomalies, civil-military friction, or exercises; verification of these signals against credible open sources is essential before operationalizing response. NSW alone accounts for 32.6 risk units—nearly 4.4× the NT's score—indicating concentrated vulnerability in Australia's largest economic and population centre.
Key Developments
Note: GeoBit event signals from 2026-06-08 to 2026-06-10 include multiple "Conventional Military Force" and "Arrest/Detain" events, but no corroborating real-time open-source reporting is available within this brief's research window. The following signal categories are flagged for immediate analyst investigation but cannot yet be presented as confirmed incidents:
- 2026-06-08 – Multiple cross-attributed military-force events (AUSTRALIA vs AUSTRALIA; AUSTRALIA vs ANTHONY ALBANESE; ANTHONY ALBANESE vs AUSTRALIA; PROFESSOR vs AUSTRALIA) and public statements regarding the Supreme Court. Status: Requires urgent cross-referencing with ABC News live blogs, SBS, and official police/defence statements to establish factual basis.
- 2026-06-08–09 – Arrest/Detain events attributed to GREECE vs AUSTRALIA (×2 signals) and parallel military-force notation. Status: Likely diplomatic or consular incident; verify via DFAT statements, Greek ministry statements, or credible wire services (AAP, Reuters).
- 2026-06-10 – Public statements from unnamed EMPLOYEE and AUSTRIAN vs EMPLOYER. Status: Low operational clarity; may reflect workplace dispute or labour-relations communication unrelated to security risk.
- 2026-06-10 – Unnamed public statement on Australia. Status: Insufficient metadata; cross-check against national media digests.
Critical gap: No verified incidents (location, time, casualty count, confirmed agency statement) in the last 24–48 hours have been confirmed via independent news sources or official feeds at the time of this brief's completion.
Highest-Risk Areas
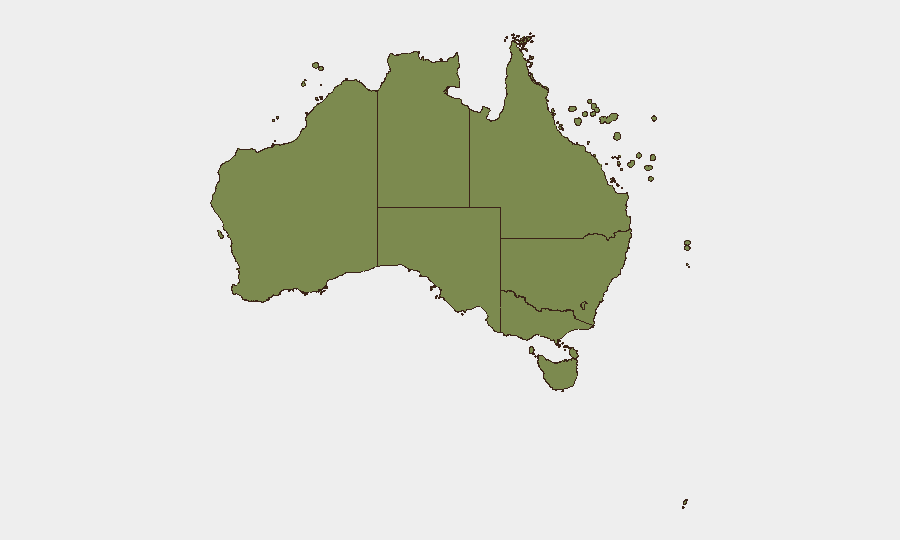
New South Wales dominates the sub-national risk profile at 32.6 units, driven by concentrated economic activity, large urban population, and (currently) unclear event signals in Sydney and surrounding regions. The Northern Territory's score of 14.8 reflects lower absolute events but higher relative volatility, likely linked to remote infrastructure, border dynamics, and smaller institutional resilience. Western Australia (10.9) follows, potentially reflecting civil unrest, resource-sector disputes, or cross-border activity. Victoria, ACT, Queensland, and southern states remain substantially lower-risk; offshore territories (Ashmore, Cartier, Coral Sea Islands, Jervis Bay) carry minimal threat scores consistent with limited permanent population and infrastructure.
How GeoBit Would Assist
Security teams should employ AOI Monitoring & Early Warning to track NSW and NT with persistent alerting for civil unrest, infrastructure disruption, or military/police activity; OSINT fusion & corroboration (X/Twitter OSINT, news feeds, official state/federal agency statements) to validate event signals and reduce false positives; and network & actor analysis to map the relationships between the political, military, and institutional entities referenced in the 2026-06-08 signals, clarifying whether events represent conflict, exercises, or data errors.
7-Day Outlook
Trajectory depends critically on verification of the 2026-06-08 military-force signals. If substantiated, expect heightened civil-military or political tension; if data artifacts, expect normalization to baseline NSW+NT operational risk. Monitor ABC News, state police, and defence official channels for clarification.
Highest-Risk Areas — Ranked
| # | State / Region | Risk |
|---|---|---|
| 1 | New South Wales | 32.6 |
| 2 | Northern Territory | 14.8 |
| 3 | Western Australia | 10.9 |
| 4 | Victoria | 7.4 |
| 5 | Australian Capital Territory | 7 |
| 6 | Queensland | 5.6 |
| 7 | Tasmania | 3.9 |
| 8 | South Australia | 3.7 |
| 9 | Ashmore and Cartier Islands | 2.6 |
| 10 | Jervis Bay Territory | 2.6 |
| 11 | Coral Sea Islands | 2.6 |
Sources
Previous Daily Briefs
A new Australia brief is written every day — each with its own risk map and downloadable CSV. Here's the last week; use the calendar to go further back.
📅 Browse every day by calendar →
Highlighted days have a brief. Tap a day for that day's map & analysis, or “csv” for that day's dataset ($5).