Situation Summary
Cuba remains at composite threat level 8/100 (rank #125 globally) with 96 tracked security events. Infrastructure stress—particularly power cuts, fuel shortages, and telecom disruption—persists nationwide as of 22 June 2026 and continues to degrade service reliability and population mobility. Recent event signals (20–22 June) show clustering around military activity, public dissent, university demonstrations, and police/government statements, suggesting localized friction rather than systemic breakdown. Overall trajectory remains volatile but contained.
Key Developments
- University demonstrations and political dissent (21 June, location unspecified but flagged as UNIVERSITY vs CUBAN actor pairing) — public rallies tied to political grievance; police public statements issued in response.
- Conventional military force activity (22 June, ARMY actor) — nature and location not detailed in available signals; warrants clarification on scale and intent.
- Government public statement re: neighborhood issues (20 June, GOVERNMENT vs NEIGHBORHOOD) — local civic or service-delivery dispute; significance not yet contextualized.
- Regime disapproval signals and rejection statements (20 June, multiple CUBAN and CUBAN vs REGIME actors) — indicative of ambient civil discontent; no specific incident pinpointed.
- National infrastructure ongoing — power cuts, blackouts (some exceeding 24 hours), fuel shortages, and telecom unreliability remain active constraints on movement, commerce, and communications as of 22 June.
Note: Available open-source signals do not yield specific incident locations or casualty/impact detail for 21–22 June. GeoBit event feeds flag activity clusters but require field corroboration.
Highest-Risk Areas
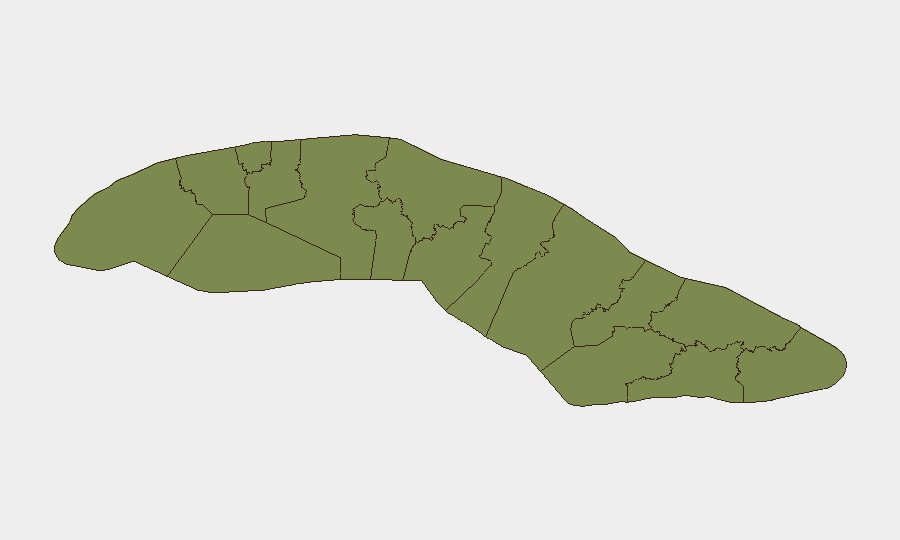
Sancti Spiritus (32.7) dominates the sub-national risk landscape by a factor of 2× over Havana (16.4), suggesting concentrated civil or security friction in Cuba's central region; Villa Clara (7.1) and Artemisa (6.7) follow as secondary hotspots. The eastern and western peripheries (Guantánamo, Pinar del Rio, Matanzas, Cienfuegos) remain below 3.1 composite risk. The disparity implies that duty-of-care exposure is highest in Sancti Spiritus and Havana; teams operating in Sancti Spiritus especially should assume elevated ambient risk and limited telecom/transport redundancy given concurrent infrastructure strain.
How GeoBit Would Assist
Intel Sweep & OSINT Fusion would consolidate X/Twitter, Telegram, and local news feeds to identify specific incident locations, actor intent, and event timelines within 2–6 hours of occurrence. AOI Monitoring & Early Warning applied to Sancti Spiritus and Havana would provide persistent alerting on demonstrations, security force mobilization, and infrastructure outages affecting corporate asset access and staff safety. Routing & Network Analysis would enable security teams to pre-plan alternative travel corridors and supply logistics around confirmed blackout zones and checkpoints, reducing duty-of-care exposure to unplanned delays or stranding.
7-Day Outlook
Ambient dissent and infrastructure stress are likely to persist through late June; no indicators suggest imminent escalation to widespread violence or regime instability. University activity may yield additional localized demonstrations. Telecom and power reliability should be assumed degraded; teams should activate contingency communication protocols and assume 24–48-hour service interruptions as routine, not exceptional.
Highest-Risk Areas — Ranked
| # | State / Region | Risk |
|---|---|---|
| 1 | Sancti Spiritus | 32.7 |
| 2 | Havana | 16.4 |
| 3 | Villa Clara | 7.1 |
| 4 | Artemisa | 6.7 |
| 5 | Camagüey | 4.2 |
| 6 | Santiago de Cuba | 3.7 |
| 7 | Las Tunas | 3.4 |
| 8 | Mayabeque | 3.1 |
| 9 | Guantánamo | 3.1 |
| 10 | Pinar del Rio | 2.7 |
| 11 | Matanzas | 2.7 |
| 12 | Cienfuegos | 2.7 |
Sources
Previous Daily Briefs
A new Cuba brief is written every day — each with its own risk map and downloadable CSV. Here's the last week; use the calendar to go further back.
📅 Browse every day by calendar →
Highlighted days have a brief. Tap a day for that day's map & analysis, or “csv” for that day's dataset ($5).