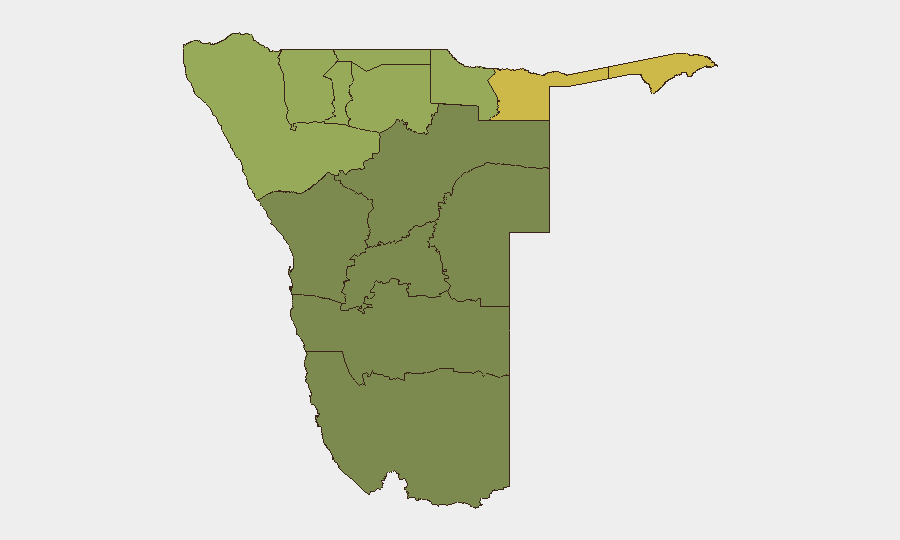
Situation Summary
Namibia remains a low-threat operating environment at the national level (composite score 8), with no confirmed security, civil unrest, or infrastructure incidents documented in the last 24–48 hours across credible open sources. Northern border regions—particularly Zambezi, Kavango East, and Kavango West—carry elevated composite risk scores (68, 62, and 58 respectively), driven by persistent cross-border dynamics and historical labour/political sensitivities rather than acute current events. The security posture is stable, though duty-of-care teams should maintain awareness of structural vulnerabilities in high-risk regions and monitor for spillover effects from regional activity.
Key Developments
No acute security, conflict, civil unrest, crime, political instability, or infrastructure incidents meeting corroboration and recency thresholds (last 24–48 hours) were identified in Namibian open sources during this reporting window.
Note on recent signals: Platform event feeds flagged a 17 June public statement (DEPUTY vs NAMIBIA) and 18 June military/police power show, but these have not been corroborated by multi-source reporting or clearly characterized as acute incidents in available news or social media. Further intelligence collection is recommended if escalation indicators emerge.
Open-source commentary in the last 48 hours reflects routine activity: cybersecurity improvements noted in national assessments, Q1 2026 telecoms investment updates, and constructive labour engagement dialogue (e.g., Beifang Mining Services), none of which indicate active disruption or risk escalation.
Highest-Risk Areas
Zambezi Region (risk 68) and the two Kavango regions (East 62, West 58) lead sub-national risk exposure. These northern territories share borders with Angola and Zambia, creating exposure to cross-border criminal networks, poaching, and potential spillover from regional political or security shifts. Kunene (52) and Oshikoto (48) sustain secondary risk profiles linked to remote terrain, informal economies, and historical labour activism. Central and southern regions—Oshana, Otjozondjupa, Erongo, and Hardap—present materially lower risk (40–28 range) and are preferred for stable operations. Risk concentration in the north reflects geography, border dynamics, and governance capacity rather than current acute crisis.
How GeoBit Would Assist
AOI Monitoring & Early Warning services would establish persistent watch on Zambezi and Kavango regions, flagging emerging unrest, cross-border movement, or labour mobilization before escalation. Intel Sweep, OSINT fusion, and multi-language social/news feeds enable continuous corroboration of signals—distinguishing genuine incidents from routine statements—critical given the low event density and the need to avoid false alarms. Routing & Network Analysis supports duty-of-care teams planning secure movement or supply chains in higher-risk northern zones, while satellite & GIS spatial analysis tracks infrastructure integrity and informal settlement patterns that may signal emerging grievances or operational vulnerability.
7-Day Outlook
No imminent acute threat is forecast. Baseline monitoring of northern border regions should continue, with particular attention to any labour mobilization, political messaging, or cross-border security incidents (poaching, smuggling interdiction) that historically precede broader instability. If the 17–18 June signals (deputy statement, military/police activity) reflect substantive policy or enforcement shifts, corroborating reporting should emerge within 3–5 days; absence of escalation signals would suggest routine governance activity.
Highest-Risk Areas — Ranked
| # | State / Region | Risk |
|---|---|---|
| 1 | Zambezi | 68 |
| 2 | Kavango East | 62 |
| 3 | Kavango West | 58 |
| 4 | Kunene Region | 52 |
| 5 | Oshikoto | 48 |
| 6 | Ohangwena | 45 |
| 7 | Omusati | 42 |
| 8 | Oshana | 40 |
| 9 | Otjozondjupa | 35 |
| 10 | Erongo Region | 32 |
| 11 | Hardap | 28 |
| 12 | Omaheke | 25 |
Sources
Previous Daily Briefs
A new Namibia brief is written every day — each with its own risk map and downloadable CSV. Here's the last week; use the calendar to go further back.
📅 Browse every day by calendar →
Highlighted days have a brief. Tap a day for that day's map & analysis, or “csv” for that day's dataset ($5).