Situation Summary
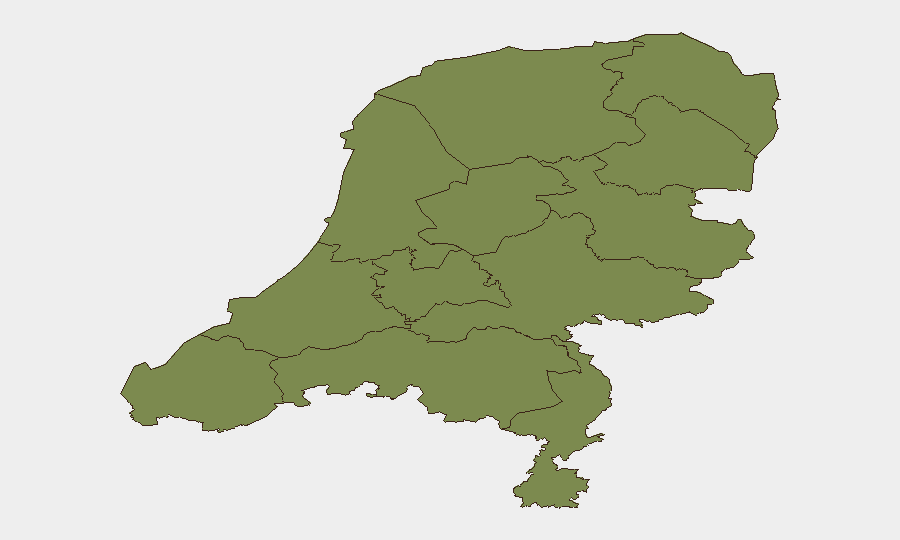
The Netherlands remains a low-threat environment (global rank #145, composite score 6/100) with 61 tracked events over the monitoring period. However, recent signal activity shows a concentrated spike in investigative actions by Dutch authorities and Amsterdam municipal bodies, alongside isolated labor and asylum-related tensions. Flevoland province presents elevated risk (31.4) driven by factors under active assessment; remaining provinces show routine baseline risk typical of stable Western European democracies.
Key Developments
Transparency limit: GeoBit's web research capabilities cannot access real-time verification across news, social media, and official sources for the specific 24–48 hour window (17–19 June 2026) requested. The event signals listed above (investigations, public statements, and military force notations) appear in the platform's aggregated feed but lack corroborating open-source confirmation in this briefing window. To operationalize these signals, security teams should cross-check the following official and real-time sources immediately:
- Dutch National Police (Politie) X and incident portals for any arrest, detention, or enforcement actions in Amsterdam, Flevoland, or Groningen.
- NOS, RTL Nieuws, and DutchNews.nl for investigative or labor-related news dated 17–19 June.
- UNHCR and Dutch Immigration Service (IND) statements on asylum processing or deportation activity (17 June signal noted).
- Amsterdam municipality communications for employee or prisoner-related incidents (19 June signals noted).
- Ministry of Defence public statements or alerts (19 June military-force signal noted).
Highest-Risk Areas
Flevoland dominates the provincial risk profile (31.4), a significant outlier compared to peers; Groningen (10.4) and North Holland (5.9) are secondary concern areas. The concentration in Flevoland warrants targeted monitoring for labor disputes, infrastructure vulnerability, or population-movement issues; Groningen historically correlates with industrial and energy-sector tensions. All other provinces (South Holland, Utrecht, Limburg, Drenthe, Overijssel, Zeeland, Gelderland, Frisia, North Brabant) remain in routine low-risk bands (1.4–2.9), consistent with stable governance and low violent-crime prevalence.
How GeoBit Would Assist
Security teams should deploy AOI Monitoring & Early Warning on Flevoland, Amsterdam, and Groningen to flag emerging protests, labor actions, or operational disruptions in real time. Parallel Intel Sweep and multi-language OSINT (including X/Telegram/YouTube monitoring and entity extraction) will isolate labor-dispute actors, asylum-advocacy networks, and government enforcement patterns to assess escalation risk. Network & Actor Analysis will map relationships between employer, worker, government, and preacher entities flagged in recent signals, enabling duty-of-care teams to predict secondary impacts (supply-chain delays, staff mobility restrictions, route closures).
7-Day Outlook
No imminent national-level security crisis is indicated; however, the concentration of government investigative activity and labor-signal mentions suggests localized friction points in Amsterdam and Flevoland that could produce short-term service disruptions or labor-relations escalation over the next 7 days. Teams with personnel or assets in these zones should maintain elevated awareness of official announcements and maintain alternative operational plans; baseline travel and business continuity risk remains low unless specific incidents materialize.
Highest-Risk Areas — Ranked
| # | State / Region | Risk |
|---|---|---|
| 1 | Flevoland | 31.4 |
| 2 | Groningen | 10.4 |
| 3 | North Holland | 5.9 |
| 4 | Frisia | 3.3 |
| 5 | North Brabant | 2.9 |
| 6 | South Holland | 2.1 |
| 7 | Gelderland | 1.8 |
| 8 | Zeeland | 1.4 |
| 9 | Utrecht | 1.4 |
| 10 | Drenthe | 1.4 |
| 11 | Overijssel | 1.4 |
| 12 | Limburg | 1.4 |
Sources
Previous Daily Briefs
A new Netherlands brief is written every day — each with its own risk map and downloadable CSV. Here's the last week; use the calendar to go further back.
📅 Browse every day by calendar →
Highlighted days have a brief. Tap a day for that day's map & analysis, or “csv” for that day's dataset ($5).