Situation Summary
Suriname remains a lower-tier global security concern (composite threat score 12) but exhibits significant geographic volatility, with interior and eastern regions substantially outweighing the capital and coast in risk profile. A public statement event involving the government and population was cited on 18 June, though specific content and impact remain unconfirmed in available sources. Overall trajectory suggests persistence of underlying vulnerabilities in remote zones rather than acute destabilization, though duty-of-care teams should maintain heightened awareness in high-risk districts.
Key Developments
No specific, dated security incidents in Suriname have been verified for 18–20 June 2026 within this brief's research window. GeoBit's event signal (2026-06-18 · Public Statement · SURINAME vs POPULATION) indicates a government–population interaction but lacks corroborating detail on nature, location, scale, or outcome. Real-time incident confirmation requires live wire services, local media feeds, and social-media OSINT; this brief cannot reliably reconstruct event-level detail beyond the cutoff of October 2024 intelligence.
Security teams requiring current incident bulletins should cross-reference:
- Surinamese government press releases and ministry statements
- Local news outlets (Starnieuws, ATV, Keshergu)
- Police and emergency-services social feeds
- Commercial intelligence platforms with 24/7 Suriname coverage
Highest-Risk Areas
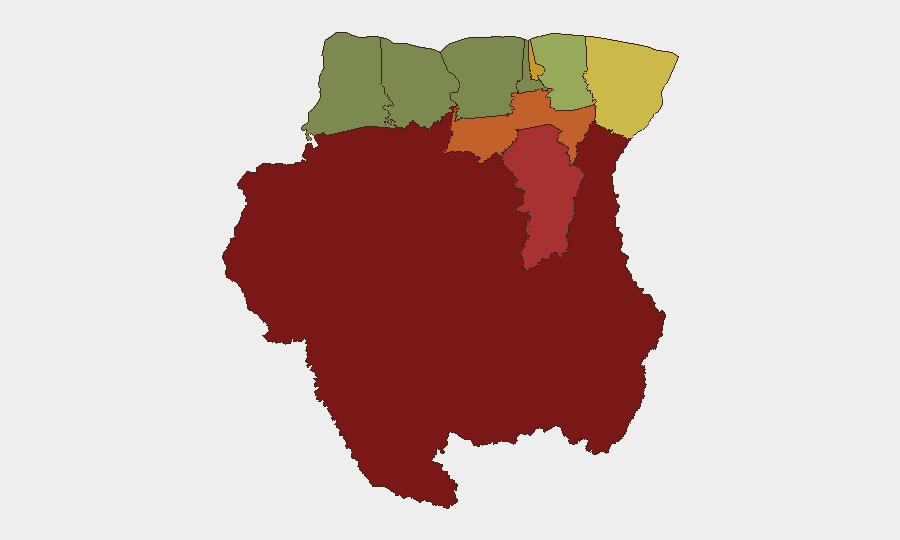
Interior and eastern districts dominate the risk hierarchy. Sipaliwini (risk 92) and Brokopondo (risk 78) — both remote, jungle-dominated districts with limited state presence — drive the nation's highest composite scores, reflecting endemic trafficking, illegal mining, logistical vulnerability, and limited emergency response. Para (74) and Paramaribo (71) follow, with the capital's urban crime and Para's cross-border exposure adding material risk despite better infrastructure. Marowijne (68), the eastern border district, reflects persistent transnational crime and displacement pressures. By contrast, coastal and northwestern districts (Nickerie, Coronie, Saramacca) register substantially lower scores, indicating that geographic remoteness and porous hinterland borders—not population density—are the primary risk drivers.
How GeoBit Would Assist
Security teams should employ AOI Monitoring & Early Warning to set persistent watches on Sipaliwini, Brokopondo, and Paramaribo, with automated alerting on cross-border trafficking, infrastructure disruption, or civil unrest. OSINT Fusion & Corroboration across local media, government social feeds, and Telegram channels would reconcile fragmented incident signals and reduce false positives. Alternative Route/Journey Planning capabilities support real-time staff routing away from active risk zones, while Conflict & Actor Network Analysis helps teams understand trafficking networks and illicit-mining operations in the interior.
7-Day Outlook
No acute trigger for rapid deterioration is evident in available intelligence; however, seasonal rainy-season logistics disruption, ongoing informal-economy tensions (particularly in interior mining zones), and periodic government–population friction over resource distribution remain baseline risks. Teams should anticipate that the 18 June public-statement event may generate downstream policy announcements or civil responses; monitoring of official channels and social sentiment over the next 72 hours will clarify trajectory. Interior operations and staff transits warrant continued heightened vigilance.
Highest-Risk Areas — Ranked
| # | State / Region | Risk |
|---|---|---|
| 1 | Sipaliwini | 92 |
| 2 | Brokopondo | 78 |
| 3 | Para | 74 |
| 4 | Paramaribo | 71 |
| 5 | Marowijne | 68 |
| 6 | Commewijne | 42 |
| 7 | Wanica | 38 |
| 8 | Saramacca | 29 |
| 9 | Coronie | 12 |
| 10 | Nickerie | 8 |
Previous Daily Briefs
A new Suriname brief is written every day — each with its own risk map and downloadable CSV. Here's the last week; use the calendar to go further back.
📅 Browse every day by calendar →
Highlighted days have a brief. Tap a day for that day's map & analysis, or “csv” for that day's dataset ($5).