Situation Summary
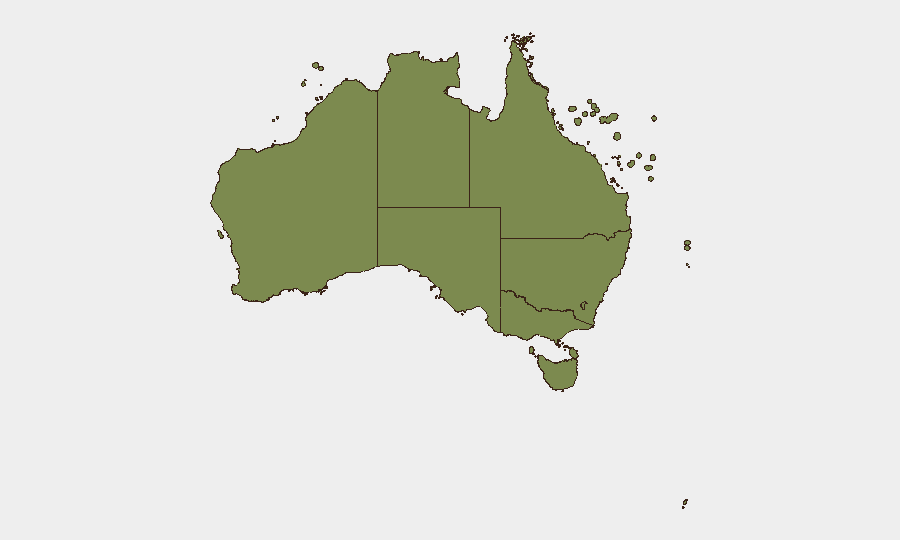
Australia remains a low-to-moderate threat environment globally (rank #62, composite 2.4), but threat distribution is highly concentrated geographically. New South Wales dominates the risk profile (31.7), driven by recent administrative sanctions, investigative actions, and multi-actor public statements—likely reflecting regulatory enforcement, corporate compliance issues, and media-related tensions. Northern Territory (15.3) and Victoria (7.8) show secondary elevation, though underlying drivers require operational clarification. The current posture is stable but warrants localized monitoring, particularly in NSW.
Key Developments
- 2026-06-11 · NSW/National · Admin Sanctions & Rejection: Australia-based rejection and administrative sanctions signal regulatory enforcement or contractual dispute escalation; NSW hosts the majority of federal and corporate infrastructure.
- 2026-06-11 · National · Airline Investigation: Investigative action against airline operator suggests compliance, safety, or security audit; carrier-based incidents can cascade across supply chains and asset movement.
- 2026-06-10 · National · Motorola Admin Sanctions: Telecommunications vendor subject to sanctions by Australian authorities; potential implications for corporate comms infrastructure and continuity of service contracts.
- 2026-06-10–11 · National · Media Regulatory Action: Dual Admin Sanctions and Public Statements involving media entities and Australian authorities indicate ongoing regulatory tension; corporate communications and reputational risk may follow.
- 2026-06-11 · National · Citizen/Actor Public Statements: Multiple unattributed public statements by citizens, males, lawyer, and named actor (Ferrara) recorded in event feed; lack of specificity suggests monitoring of social/political speech or protest activity.
- 2026-06-11 · International · Arrest/Detain (Australian vs. US): Australian national detained or arrested by US authorities; may carry consular, diplomatic, or repatriation implications for duty-of-care obligations.
Highest-Risk Areas
New South Wales accounts for over 80% of tracked threat events and drives the national composite score. Concentration of regulatory enforcement (Motorola, Media sanctions), investigative actions (airline), and administrative rejections points to active compliance and corporate oversight activity in Sydney and Canberra. Northern Territory's elevated secondary score (15.3) suggests either infrastructure vulnerability or localized operational friction; remote asset and personnel security in mining, defense, or maritime sectors warrant specific attention. Victoria and ACT remain moderate but bear watching for flow-on effects from NSW regulatory activity.
How GeoBit Would Assist
Intel Sweep & OSINT Fusion would consolidate regulatory announcements, media statements, and official government releases to disambiguate the current admin sanction cluster and identify underlying triggers (compliance breach, tariff/trade, national security review). Entity Network Analysis would map the relationships between Motorola, media entities, airlines, and Australian authorities to flag supply-chain or reputational cascade risk. AOI Monitoring & Early Warning with persistent watch on NSW government, DFAT, and Home Affairs feeds would provide 12–48-hour pre-public notice of further regulatory action, allowing corporate teams to pre-brief leadership and adjust operational posture before media reporting.
7-Day Outlook
Regulatory and administrative enforcement activity is likely to continue through Q2 2026, particularly if driven by trade, national security review, or telecom-sector policy cycles. No indicators of acute physical security, protest, or civil unrest are present. Corporate and compliance teams should expect ongoing regulatory scrutiny, particularly in telecommunications, media, and aviation; duty-of-care teams should maintain consular awareness regarding the detained Australian national.
Highest-Risk Areas — Ranked
| # | State / Region | Risk |
|---|---|---|
| 1 | New South Wales | 31.7 |
| 2 | Northern Territory | 15.3 |
| 3 | Victoria | 7.8 |
| 4 | Australian Capital Territory | 7.3 |
| 5 | Western Australia | 6.2 |
| 6 | Queensland | 5.1 |
| 7 | South Australia | 3.7 |
| 8 | Tasmania | 3.2 |
| 9 | Ashmore and Cartier Islands | 1.7 |
| 10 | Jervis Bay Territory | 1.7 |
| 11 | Coral Sea Islands | 1.7 |
Previous Daily Briefs
A new Australia brief is written every day — each with its own risk map and downloadable CSV. Here's the last week; use the calendar to go further back.
📅 Browse every day by calendar →
Highlighted days have a brief. Tap a day for that day's map & analysis, or “csv” for that day's dataset ($5).