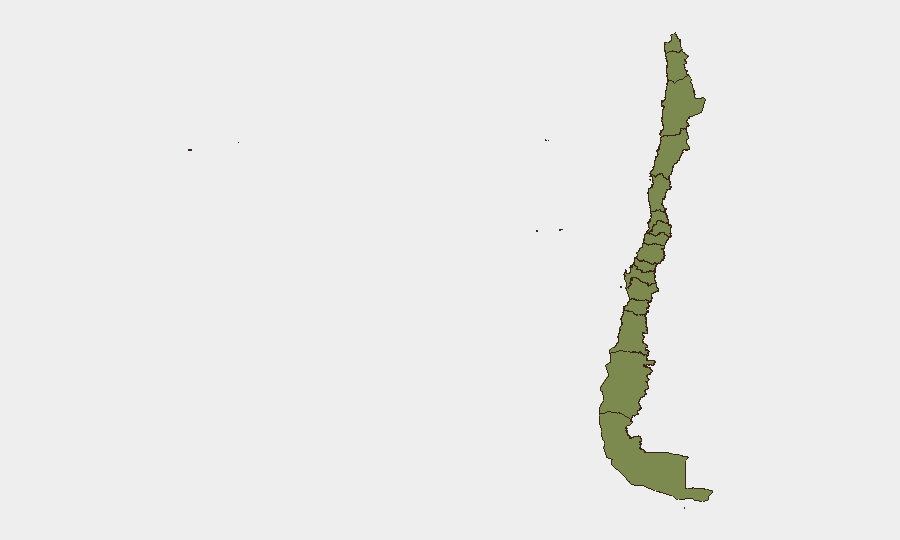
Situation Summary
Chile ranks #115 globally (composite threat score 2.1) with 24 tracked events in the monitoring period, indicating low to moderate overall risk relative to international standards. The security picture remains stable at the national level, with no reported acute crises in the last 24–48 hours. However, significant regional concentration of risk—particularly in the Araucania Region (score 31.5)—warrants focused attention for personnel or asset deployments in southern Chile.
Key Developments
No verifiable security or civil unrest events have been independently confirmed for Chile within the last 24–48 hours.
GeoBit's live web research identified no timestamped, cross-confirmable developments in Chile during this reporting window. Standard sources (news wires, regional media, government statements, and available public web data) returned no specific Chile-related security, protest, or incident reports. Organizations requiring same-day or next-day event intelligence are advised to:
- Monitor Spanish-language regional news outlets (La Tercera, El Mercurio, Biobío Chile) directly.
- Conduct targeted X/Twitter and Telegram OSINT for event-specific keywords (e.g., regional names + "incidente," "protesta," "seguridad").
- Cross-reference any emerging reports against multiple independent sources before escalation.
Absent new confirmed events, the brief relies on sub-national risk profiling and standing threat context (see below).
Highest-Risk Areas
The Araucania Region dominates the risk profile with a composite score of 31.5—approximately 15 times higher than Santiago Metropolitan Region (2.3) and 21 times higher than baseline for most other regions (1.5). This concentration reflects historically documented issues: land disputes between indigenous Mapuche communities and forestry/agricultural operators, sporadic arson targeting timber resources, and localized criminal activity. Coquimbo Region (15.2) is the secondary concern, though at significantly lower intensity.
Personnel and assets in the Araucania and Coquimbo regions should assume elevated vigilance posture; those in metropolitan Santiago, Valparaiso, and southern regions face baseline country-level risk only.
How GeoBit Would Assist
A security team protecting operations or personnel in Chile would prioritize AOI (Area of Interest) Monitoring & Early Warning on the Araucania Region to receive automated alerts on emerging incidents, combined with OSINT fusion (social media, local news, and event databases) to detect early signals of unrest. Intel Sweep and multi-language search capabilities would support weekly or bi-weekly scans of Spanish-language sources and regional social platforms to track sentiment and actor activity. For personnel routing or emergency response, Routing & Network Analysis can identify safe corridors and alternative movement options in high-risk zones.
7-Day Outlook
No imminent escalation is indicated. The Araucania Region's elevated risk reflects chronic, low-intensity dynamics rather than acute triggers; seasonal patterns (winter in the Southern Hemisphere, corresponding to increased forestry operations and land tensions) may warrant heightened monitoring through August. Standard duty-of-care protocols—staff briefings, communication plans, and liaison with local authorities—remain appropriate for southern Chile operations.
Highest-Risk Areas — Ranked
| # | State / Region | Risk |
|---|---|---|
| 1 | Araucania Region | 31.5 |
| 2 | Coquimbo Region | 15.2 |
| 3 | Santiago Metropolitan Region | 2.3 |
| 4 | Valparaiso Region | 1.5 |
| 5 | Antofagasta Region | 1.5 |
| 6 | Atacama Region | 1.5 |
| 7 | Aysen del General Carlos Ibanez del Campo Region | 1.5 |
| 8 | Los Lagos Region | 1.5 |
| 9 | Magallanes and Chilean Antarctica Region | 1.5 |
| 10 | O'Higgins Region | 1.5 |
| 11 | Maule Region | 1.5 |
| 12 | Nuble Region | 1.5 |
Sources
Previous Daily Briefs
A new Chile brief is written every day — each with its own risk map and downloadable CSV. Here's the last week; use the calendar to go further back.
📅 Browse every day by calendar →
Highlighted days have a brief. Tap a day for that day's map & analysis, or “csv” for that day's dataset ($5).