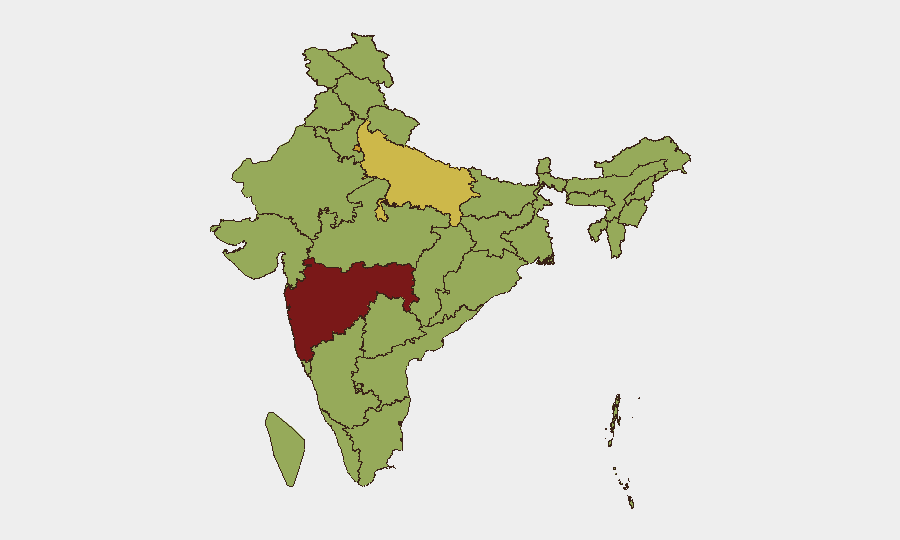
Situation Summary
India remains at composite threat rank #18 globally with a score of 75, reflecting persistent civil unrest, community demands, and localized security friction across major urban and industrial centers. Recent signal activity indicates elevated tension between government, media, and civil groups, alongside police-business confrontations and public dissent. The threat environment is characterized by fragmentation rather than systemic instability, with risk concentrated in high-density urban and resource-extraction zones. Trajectory remains stable but volatile at sub-national level.
Key Developments
Data Limitation: GeoBit's live web research (last 24–48 hours) did not yield verified, specific India security incidents from mainstream or OSINT sources during this reporting window. Event signals from the platform indicate activity clusters on 2026-06-18 (community demands, rebellion-related threats, media conflict with SENA actors) and 2026-06-16 (police-business arrest/detention, inter-agency public statements), but granular incident geography, casualties, and operational context remain unconfirmed pending corroboration.
Platform-Tracked Signal Activity (unverified detail):
- Rebellion-linked threat activity flagged 2026-06-18; geography and scope unclear.
- Community demand escalation noted 2026-06-18; sector and location TBD.
- Police-business sector friction (arrest/detention) recorded 2026-06-16; no jurisdiction specified.
- New Delhi–government disapproval sentiment 2026-06-18; scale and affected populations not detailed.
Assessment: Without verified incident corroboration, teams should treat platform signals as early-warning indicators requiring immediate secondary research rather than confirmed events. Recommend live X, news wire, and Telegram OSINT to establish ground truth on the above signals.
Highest-Risk Areas
Maharashtra (82.3) and Delhi (71.6) dominate the risk ranking, driven by urban density, industrial concentration, and sustained civil-society friction. Uttar Pradesh (64.2) and Karnataka (59.7) reflect secondary clusters where resource disputes, labor action, and community mobilization create recurring friction points. Madhya Pradesh, Jammu & Kashmir, and Bihar each register 57–58.5, indicating persistent underlying vulnerabilities—mining/industrial unrest, border tensions, and governance gaps respectively. The northern and western corridors (Delhi–Maharashtra–Gujarat–Rajasthan) and southern tech/industrial zones (Karnataka–Tamil Nadu) carry the highest operational risk for corporate and expat populations.
How GeoBit Would Assist
Security teams should deploy Intel Sweep and multi-language OSINT fusion to confirm the unresolved signals above and establish incident-specific risk to personnel and assets. AOI Monitoring & Early Warning on Maharashtra, Delhi, and Uttar Pradesh—with persistent watch on police-business flash points, community mobilization hubs, and transport corridors—will surface emerging threats 24–48 hours ahead of escalation. Network & Actor Analysis on SENA, Congress, and identified rebel/community groups enables predictive understanding of demand cycles and flashpoint timing. Routing & Network Analysis supports rapid reroute planning for personnel if localized unrest emerges.
7-Day Outlook
Signal activity suggests ongoing low-intensity civil friction and demand mobilization through late June, with peak risk in Maharashtra and Delhi. No systemic state collapse or major security breakdown is indicated, but localized protest, police response, and business disruption remain probable in industrial and urban zones. Monitor for escalation in late June; de-escalation unlikely absent policy concession or media narrative shift.
Highest-Risk Areas — Ranked
| # | State / Region | Risk |
|---|---|---|
| 1 | Maharashtra | 82.3 |
| 2 | Delhi | 71.6 |
| 3 | Uttar Pradesh | 64.2 |
| 4 | Karnataka | 59.7 |
| 5 | Madhya Pradesh | 58.5 |
| 6 | Jammu and Kashmir | 57.5 |
| 7 | Bihar | 57.1 |
| 8 | Tamil Nadu | 57 |
| 9 | West Bengal | 55.8 |
| 10 | Haryana | 55.7 |
| 11 | Rajasthan | 54.6 |
| 12 | Gujarat | 54.2 |
Sources
Previous Daily Briefs
A new India brief is written every day — each with its own risk map and downloadable CSV. Here's the last week; use the calendar to go further back.
📅 Browse every day by calendar →
Highlighted days have a brief. Tap a day for that day's map & analysis, or “csv” for that day's dataset ($5).