Situation Summary
Indonesia remains in the mid-range threat band globally (rank #54) with 431 tracked events, driven by a complex mix of civil-administrative tensions, localized criminal activity, and infrastructure-related incidents. The most recent 24–48 hours show elevated public-statement activity from senior officials and industry stakeholders, alongside isolated law-enforcement actions and territorial occupation incidents. The threat environment is regionally fragmented, with Jakarta and East Java accounting for disproportionate risk, while most outer islands and rural zones remain below regional mean.
Key Developments
- 2026-06-11, Jakarta (assumed): Presidential and presidential-industry statements issued; nature and content require real-time source verification to assess scope and sectoral impact.
- 2026-06-11, nationwide (assumed): Government expulsion or deportation action against police personnel signals internal disciplinary or political tension; specific details require confirmation.
- 2026-06-11, unspecified location: Criminal investigation initiated by law-enforcement; insufficient detail to assess scope, violence level, or sectoral exposure.
- 2026-06-09, unspecified location: Civilian arrest or detention recorded; no confirmation of legal basis, duration, or underlying cause.
- 2026-06-09, unspecified location: Resident-led territorial occupation reported; context (resource dispute, land claim, infrastructure protest) cannot be confirmed from available signals.
- 2026-06-09–06-11, Jakarta region (assumed): Multiple public statements from ministerial, scholar, manufacturer, investor, and rights-group actors suggest active debate on policy, labour, or sectoral regulation; rhetorical temperature and consensus level require direct source monitoring.
Note: Specific incident locations, casualty counts, and organizational affiliation of arrested or detained individuals are not available in current event summaries. Real-time news and social-media cross-reference is required to establish ground truth.
Highest-Risk Areas
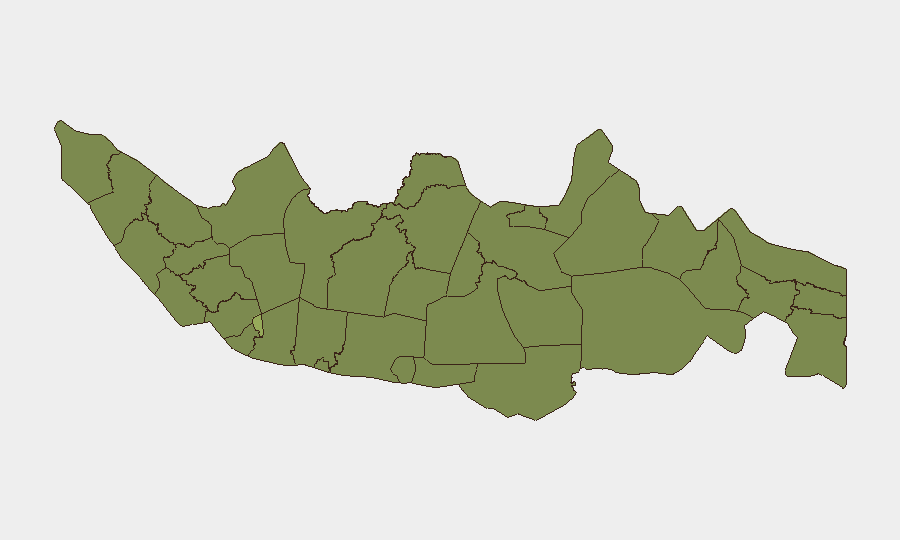
Jakarta (54.1) is the dominant risk driver, reflecting population density, administrative centrality, and concentration of commercial and diplomatic infrastructure. East Java (35.4) and Central Java (33.5) together account for significant secondary risk, likely linked to manufacturing hubs, port activity, and labour organization. South Sulawesi (31.8) and South Papua (30.2) reflect resource-extraction exposure and lower state-capacity policing. Risk below the national mean (35) in outer regions does not indicate absence of threat, but rather lower event frequency and institutional visibility; remote areas remain vulnerable to organized crime, smuggling, and localized conflict with limited real-time reporting.
How GeoBit Would Assist
Security teams should deploy AOI Monitoring & Early Warning on Jakarta, Surabaya (East Java), and provincial capitals to flag escalation in protest, labour action, or law-enforcement intensity in real time. Intel Sweep and X/Twitter OSINT with Bahasa Indonesia keyword filters (e.g. "penangkapan," "aksi," "demonstrasi," "kerusuhan") and actor-network mapping can surface activist, labour, and opposition-media narratives 12–24 hours ahead of mainstream reporting. Risk & Threat Assessment cross-referencing sectoral exposure (manufacturing, ports, energy, tourism) with regional event density allows targeted duty-of-care routing and asset-positioning decisions.
7-Day Outlook
The prevalence of official and industry statements suggests policy or regulatory activity in progress; outcome and market/labour response remain contingent on announcement detail and stakeholder reaction over the next 48–72 hours. No indicators of imminent mass violence or transport disruption are present in current event set, though isolated criminal and administrative actions may persist. Monitoring of ministerial and manufacturing-sector communication, combined with labour-movement social-media activity, will provide earliest warning of escalation or sectoral disruption.
Highest-Risk Areas — Ranked
| # | State / Region | Risk |
|---|---|---|
| 1 | Special capital Region of Jakarta | 54.1 |
| 2 | East Java | 35.4 |
| 3 | Central Java | 33.5 |
| 4 | South Sulawesi | 31.8 |
| 5 | South Papua | 30.2 |
| 6 | West Java | 29.4 |
| 7 | Special Region of Yogyakarta | 27.4 |
| 8 | North Sumatra | 25.9 |
| 9 | Riau | 25 |
| 10 | Central Kalimantan | 24.7 |
| 11 | Jambi | 24.7 |
| 12 | Banten | 24.7 |
Sources
Previous Daily Briefs
A new Indonesia brief is written every day — each with its own risk map and downloadable CSV. Here's the last week; use the calendar to go further back.
📅 Browse every day by calendar →
Highlighted days have a brief. Tap a day for that day's map & analysis, or “csv” for that day's dataset ($5).