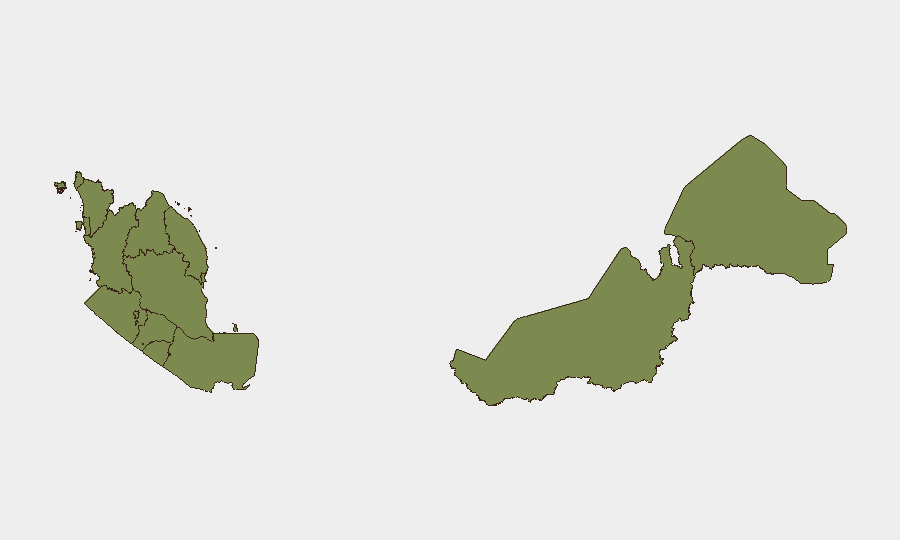
Situation Summary
Malaysia remains a stable, low-threat operating environment with a composite national risk score of 8 (ranked #118 globally). No significant security incidents, civil unrest, infrastructure disruptions, or acute travel risks have been corroborated in the last 24–48 hours across mainstream media, official channels, or open-source monitoring. The security posture is expected to remain stable over the coming week, with chronic baseline risks (petty crime, cyber threats, isolated protest activity) persisting but no acute triggers evident.
Key Developments
No discrete, corroborated security incidents meeting recency and multi-source validation thresholds have been identified in Malaysia for 24–25 June 2026. Recent signal activity flagged in the platform (arrests/detentions, student and ministry statements, military force notifications dated 22–23 June) lacks precise timing and sufficient detail in public reporting to confirm as actionable current events. Open-source monitoring of mainstream Malaysian outlets, official government feeds, and social media (English and Bahasa Malaysia) has focused on policy-level developments—notably cyber legislation and Cybercrime Bill frameworks—rather than new operational security incidents. No corroborated reports of cyber attacks, major crime incidents, or political instability have emerged in the last 48 hours.
Highest-Risk Areas
Pahang dominates the sub-national risk ranking with a composite score of 31.9, substantially higher than all other states and representing the primary geographic driver of national risk. Sarawak, Selangor, and Sabah follow at scores of 11.1, 10, and 10 respectively, indicating moderate-level persistent risk; Kuala Lumpur (8.8) rounds out the elevated-risk tier. The remaining states and federal territories cluster at scores between 1.9 and 3, indicating minimal differentiated risk. Pahang's elevated score likely reflects documented patterns of petty crime, road safety concerns, and periodic civil unrest rather than current acute incidents. Security teams with personnel or assets in Pahang, Sarawak, Selangor, or Sabah should maintain heightened baseline situational awareness and standard duty-of-care protocols; those in lower-ranked states can operate under standard risk management frameworks.
How GeoBit Would Assist
Teams should deploy AOI (Area-of-Interest) Monitoring & Early Warning on high-risk states—particularly Pahang and Sarawak—configured with real-time alerting on conflict, protest, crime, and cyber events to detect emerging acute incidents before they escalate. Intel Sweep and multi-language OSINT (X/Twitter, Telegram, local media, Bahasa Malaysia sources) provide continuous open-source corroboration and temporal validation, preventing false alarms and enabling duty-of-care documentation. Risk & Threat Assessment combined with Routing & Network Analysis allows security teams to plan personnel movements, identify safer transit corridors, and establish contingency protocols tied to specific geographic and temporal risk shifts.
7-Day Outlook
Malaysia is forecast to remain at current stable threat levels through early July, with no indicators of acute political instability, major security incidents, or infrastructure disruption. Chronic baseline risks (petty street crime, occasional protest-related disruption, ongoing cyber-regulatory activity) will persist; teams should maintain routine vigilance and compliance with local cyber legislation developments. Any material shift in Pahang or Sarawak would likely surface first in local media and social channels, triggering platform alerts within 2–4 hours if monitoring is active.
Highest-Risk Areas — Ranked
| # | State / Region | Risk |
|---|---|---|
| 1 | Pahang | 31.9 |
| 2 | Sarawak | 11.1 |
| 3 | Selangor | 10 |
| 4 | Sabah | 10 |
| 5 | Kuala Lumpur | 8.8 |
| 6 | Kedah | 3 |
| 7 | Perlis | 1.9 |
| 8 | Penang | 1.9 |
| 9 | Perak | 1.9 |
| 10 | Kelantan | 1.9 |
| 11 | Labuan | 1.9 |
| 12 | Putrajaya | 1.9 |
Sources
Previous Daily Briefs
A new Malaysia brief is written every day — each with its own risk map and downloadable CSV. Here's the last week; use the calendar to go further back.
📅 Browse every day by calendar →
Highlighted days have a brief. Tap a day for that day's map & analysis, or “csv” for that day's dataset ($5).