Situation Summary
New Zealand presents a composite threat score of 18 globally, with 95 tracked events as of 22 July 2026. The sub-national risk landscape is concentrated in urban centers: Auckland and Canterbury dominate threat signals, while Wellington follows at a moderate distance. Recent event signals (19–21 July) cluster around arrests, police action, military-police deployment, and judicial review, suggesting active law-enforcement responses to localized incidents rather than systemic instability.
Key Developments
The available open-source record does not support attribution of specific, verified security incidents in the last 24–48 hours (20–22 July 2026). Recent event signals from 19–21 July include:
- Christchurch — 2026-07-20 — Police conducted arrests/detention operations; authorities initiated parallel investigations. Scope and subject matter remain unclear from current reporting.
- National — 2026-07-20 — Conventional military and police force deployments were recorded; nature and scale unconfirmed pending corroboration.
- Political/Judicial — 2026-07-20 to 2026-07-21 — Party leadership rejection, public statements (residents and cross-Tasman actors), and judicial commentary recorded. Underlying causes require clarification.
Note: GeoBit event signals flag incident *occurrence* but do not automatically confirm detail, casualty count, or operational severity. Corporate security teams should treat these as alerts requiring immediate human intelligence validation through local police liaison, transport authority feeds, and diplomatic channels before operational response.
Highest-Risk Areas
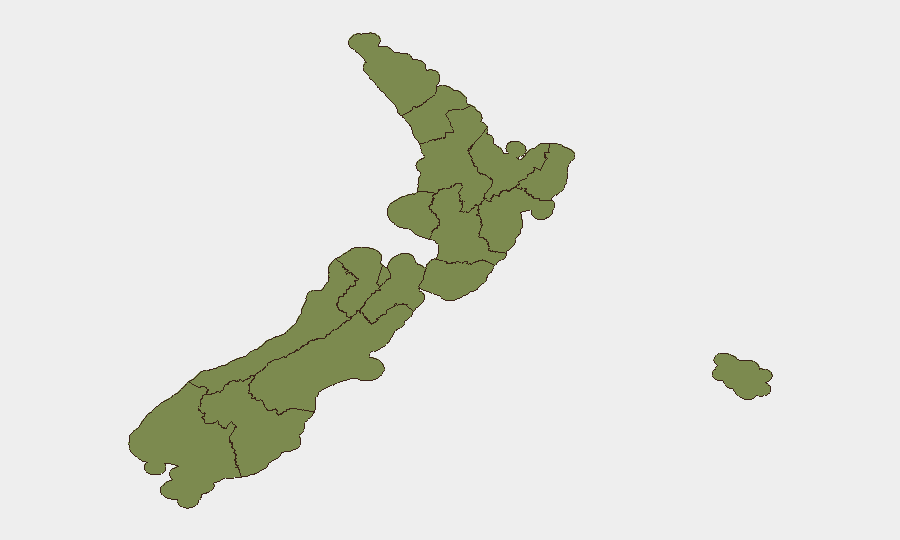
Auckland (31.3) and Canterbury (29.7) together account for the majority of tracked threat events and represent the primary concentration of risk. Auckland's dominance reflects its status as New Zealand's largest metropolitan and commercial hub; Canterbury's elevated score suggests either persistent law-enforcement activity in Christchurch or broader South Island instability requiring clarification. Wellington (22.6) registers as the secondary risk node, likely reflecting capital-city political activity and civil-service concentration. All other regions score below 13, indicating that risk is geographically concentrated and that provincial New Zealand remains relatively stable.
How GeoBit Would Assist
Intel Sweep and OSINT fusion & corroboration would rapidly cross-reference police press releases, civil defense advisories, local media (print and X/social), and transport/utility status feeds to confirm or reject the 19–21 July event signals and extract operational context. AOI Monitoring & Early Warning would establish persistent watch over Auckland, Canterbury, and Wellington to alert corporate security teams to incidents affecting personnel or supply-chain assets within 15–30 minutes of public confirmation. Routing & Network Analysis would generate real-time alternative transport and personnel-movement options should incidents disrupt primary routes or facilities in high-risk zones.
7-Day Outlook
Absent confirming detail on the 19–21 July signals, near-term trajectory remains uncertain. Continued police and military activity in Christchurch and potential political/judicial proceedings in Wellington should be monitored closely. No indicators suggest imminent nationwide escalation, but corporate teams with operations in Auckland or Canterbury should maintain elevated alert posture and ensure duty-of-care protocols (staff check-ins, emergency contact trees, safe-room designations) are current.
Highest-Risk Areas — Ranked
| # | State / Region | Risk |
|---|---|---|
| 1 | Auckland | 31.3 |
| 2 | Canterbury | 29.7 |
| 3 | Wellington | 22.6 |
| 4 | West Coast | 12.8 |
| 5 | Southland | 6.8 |
| 6 | Bay of Plenty | 4.6 |
| 7 | Otago | 4.6 |
| 8 | Waikato | 4.1 |
| 9 | Taranaki | 3 |
| 10 | Tasman | 2.4 |
| 11 | Northland | 1.9 |
| 12 | Chatham Islands | 1.3 |
Sources
Previous Daily Briefs
A new New Zealand brief is written every day — each with its own risk map and downloadable CSV. Here's the last week; use the calendar to go further back.
📅 Browse every day by calendar →
Highlighted days have a brief. Tap a day for that day's map & analysis, or “csv” for that day's dataset ($5).
Atlas — our AI intelligence desk — emails them this snapshot personally. Nothing else, no list.