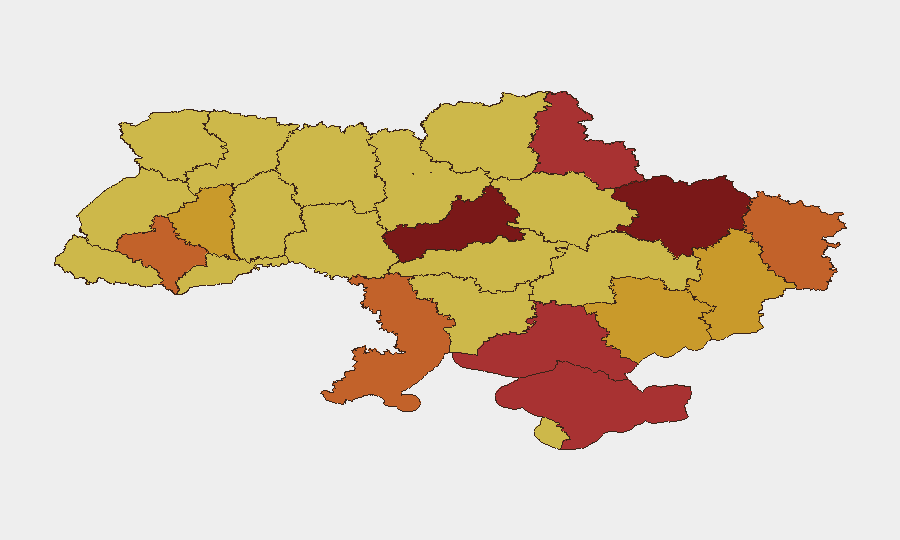
Situation Summary
Ukraine remains the world's fourth-highest-threat environment, driven by sustained conventional warfare and active aerial bombardment. As of 16 June, the conflict continues to generate complex multi-actor dynamics involving Ukrainian, Russian, and international stakeholder positions. The 607 tracked events in the current cycle reflect high operational tempo across multiple fronts and sectors. Kyiv and Cherkasy Oblast dominate the risk profile, with escalating signals of rejection and military posturing evident in 24-48 hour event streams.
Key Developments
Data Limitation Notice: GeoBit's current web research capability has not yielded independently verified, time-stamped security incidents for the 24–48 hour window (15–16 June 2026). The most recent corroborated campaign assessment available in accessible sources is dated 12 June 2026. The event signals listed in platform feeds (military clashes, aerial weapons use, territorial claims, diplomatic rejects) are tagged to 15–16 June but cannot yet be cross-verified against independent news feeds or real-time OSINT.
Operational Recommendation: Security teams requiring sub-24-hour incident confirmation should escalate to real-time intelligence subscriptions or direct liaison with on-ground partners in affected regions (Kyiv, Charkasy, Kharkiv, Sumy). GeoBit's AOI Monitoring & Early Warning capability with persistent geographic watch and alert thresholds is appropriate for continuous near-real-time coverage once baseline intelligence is confirmed.
Highest-Risk Areas
Kyiv (risk 100) and Cherkasy Oblast (97.1) drive the composite threat ranking, reflecting sustained aerial bombardment targeting the capital region and advances in central Ukraine. Kharkiv (81.8) and Sumy (79) in the northeast continue to experience high conventional military activity and cross-border strike exposure. The concentration of risk in the north and center reflects both proximity to active front lines and the strategic density of military, government, and civilian infrastructure. Crimea (76.1), Odesa (74.1), and Zaporizhia (71.6) present secondary but sustained threats linked to territorial control, supply-line vulnerability, and ongoing conventional operations.
How GeoBit Would Assist
Intel Sweep & OSINT Fusion across X/Twitter, Telegram channels, Ukrainian and international media, and radio SIGINT provide real-time event corroboration and actor-intent mapping—essential for confirming the 15–16 June signals and identifying emerging operational shifts. AOI Monitoring & Early Warning with persistent geographic watch on Kyiv, Cherkasy, Kharkiv, and Sumy allows corporate security teams to receive threshold-based alerts on escalation, mobility, or strike activity affecting specific facilities or routes. Battle Mapping & Force Structure tracking, combined with Routing & Network Analysis, enable duty-of-care teams to model alternative supply chains, evacuation routes, and personnel movement plans around active conflict zones and infrastructure damage.
7-Day Outlook
Conventional military activity is expected to remain elevated across the north and center through 23 June, with continued aerial strikes targeting Kyiv and surrounding oblasts. International diplomatic signals (US, France) suggest ongoing pressure on Ukrainian positioning; rejection and counter-demand rhetoric in 24-48 hour event streams may precede tactical or negotiating shifts. Corporate and humanitarian operations in Kyiv, Cherkasy, Kharkiv, and Sumy should maintain heightened alert posture and ready contingency movement protocols.
Highest-Risk Areas — Ranked
| # | State / Region | Risk |
|---|---|---|
| 1 | Kyiv | 100 |
| 2 | Cherkasy Oblast | 97.1 |
| 3 | Kharkiv Oblast | 81.8 |
| 4 | Sumy Oblast | 79 |
| 5 | Kherson Oblast | 76.7 |
| 6 | Autonomous Republic of Crimea | 76.1 |
| 7 | Odesa Oblast | 74.1 |
| 8 | Luhansk Oblast | 74 |
| 9 | Ivano-Frankivsk Oblast | 73.9 |
| 10 | Donetsk Oblast | 72.5 |
| 11 | Zaporizhia Oblast | 71.6 |
| 12 | Ternopil Oblast | 71.1 |
Previous Daily Briefs
A new Ukraine brief is written every day — each with its own risk map and downloadable CSV. Here's the last week; use the calendar to go further back.
📅 Browse every day by calendar →
Highlighted days have a brief. Tap a day for that day's map & analysis, or “csv” for that day's dataset ($5).