Situation Summary
Uruguay maintains a composite threat score of 3 (globally unranked) with six tracked events in the current cycle. Open-source monitoring over the last 24–48 hours has not identified clearly documented, time-stamped security incidents, crime spikes, or infrastructure disruptions. Regional volatility in South America and localized neighborhood-level activity signals remain on watch, but do not yet translate to operational escalation for most of Uruguay's territory.
Key Developments
- 2026-06-11 · Prison-related rejection signal (location/details undisclosed in available feeds; requires internal escalation for specificity).
- 2026-06-10 · Public statements on Uruguay–Colombia bilateral tensions (no reported kinetic incident; diplomatic or policy dimension; monitor for trade or consular spillover).
- 2026-06-10 · Internal political signal (Israel vs. Israel sentiment) — likely diaspora or domestic political positioning; no direct Uruguay security impact flagged.
- 2026-06-09 · Neighborhood disapproval signal — generic classification; no specific location or incident detail available in current open feeds.
- 2026-06-09 · Publication investigation signal — context unclear; may relate to media or regulatory activity; does not indicate active civil unrest.
- 2026-06-09 · Public statement (Rosario) — likely refers to Argentine Rosario, not Uruguayan asset; verify if relevant to operations.
*Note:* Signal-level events lack the temporal precision and corroborating detail typical of actionable incidents. Premium threat feeds or in-country liaison channels are recommended for incident confirmation.
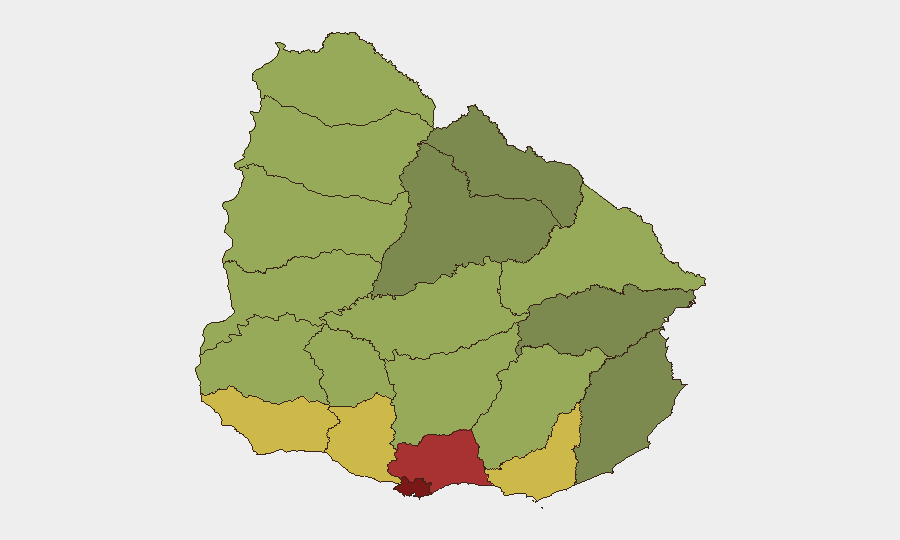
Highest-Risk Areas
Montevideo (risk 92) and Canelones (risk 78) dominate the sub-national ranking, reflecting Uruguay's urban concentration and typical crime/protest clustering in the capital and surrounding metro area. Maldonado (68), San José (64), and Colonia (62) follow, likely due to border proximity, tourism infrastructure density, and cross-border trafficking vectors. The interior departments (Salto, Artigas, Paysandú) remain lower-risk but warrant watch given their porosity to regional instability. Duty-of-care implications: Personnel and assets in Montevideo and Canelones require heightened situational awareness; border-adjacent operations should maintain contact protocols with local security authorities.
How GeoBit Would Assist
Intel Sweep and multi-language OSINT fusion would consolidate Uruguayan social media, official channels, and regional press to catch emerging signals earlier and filter noise from genuine threats. Area-of-Interest (AOI) monitoring with persistent alerting on Montevideo, border crossings, and key infrastructure (ports, airports) would provide 24/7 watch without manual polling. Network and actor analysis combined with conflict and crime search modules would help security teams map organized-crime or gang activity vectors that may affect supply chains or personnel safety, particularly in high-risk departments. Routing and network analysis can generate alternative travel or logistics routes to avoid deteriorating zones in real time.
7-Day Outlook
No imminent escalation is flagged in available signals; however, the Uruguay–Colombia public statements and prison-related activity merit close monitoring for policy shifts or organized-activity developments over the coming week. Regional South American volatility should be assumed as background risk; localized neighborhood-level friction in Montevideo and the metro area remains the primary duty-of-care concern for corporate operations. Recommend daily check-ins with in-country security coordinators and embassy alerts.
Highest-Risk Areas — Ranked
| # | State / Region | Risk |
|---|---|---|
| 1 | Montevideo | 92 |
| 2 | Canelones | 78 |
| 3 | Maldonado | 68 |
| 4 | San José | 64 |
| 5 | Colonia | 62 |
| 6 | Soriano | 58 |
| 7 | Río Negro | 56 |
| 8 | Salto | 54 |
| 9 | Artigas | 52 |
| 10 | Paysandú | 50 |
| 11 | Florida | 48 |
| 12 | Flores | 46 |
Sources
Previous Daily Briefs
A new Uruguay brief is written every day — each with its own risk map and downloadable CSV. Here's the last week; use the calendar to go further back.
📅 Browse every day by calendar →
Highlighted days have a brief. Tap a day for that day's map & analysis, or “csv” for that day's dataset ($5).