Situation Summary
Australia's composite threat score of 20 places it in the lower-to-moderate range globally, with 436 tracked events. However, sub-national risk is heavily concentrated: New South Wales drives overall risk (31.2), more than 1.7× the Northern Territory's score. Recent event signals point to domestic political tension, police investigations, and at least one small-arms incident, concentrated in the past 72 hours. The trajectory suggests simmering institutional and civil friction rather than acute security collapse, but NSW requires active monitoring.
Key Developments
- 2026-06-12 · Conventional Military Force incident involving Australia vs Police – location unspecified in available data; signals potential armed law-enforcement escalation or military-adjacent confrontation. Requires clarification on jurisdiction and circumstances.
- 2026-06-12 · Police investigations (two separate events, 2026-06-12) – both Australia-wide scope; suggests active criminal or national-security inquiry activity.
- 2026-06-10 · Small Arms Combat incident in Australia – location unspecified; indicates at least one firearm-related altercation within the reporting window.
- 2026-06-12 · Public Statement (Opposition Leader vs Australia) – political pushback on government position; consistent with domestic political friction flagged across multiple signals.
- 2026-06-12 · Public Statement (Australia vs ABC Radio) – government communication or dispute with broadcaster; suggests media-relations tension or information control narrative.
- 2026-06-11 · Administrative Sanctions (Australia vs Canada) – bilateral friction; lower immediate impact on corporate Australia but signals reputational or trade-relations strain.
- 2026-06-11 · Airline investigation – suggests potential security, safety, or compliance issue in aviation sector.
Note: Event signal taxonomy does not include precise locations or detailed circumstances; open-source verification of these incidents within the last 24–48 hours has not been independently confirmed by multiple news sources available to this analyst.
Highest-Risk Areas
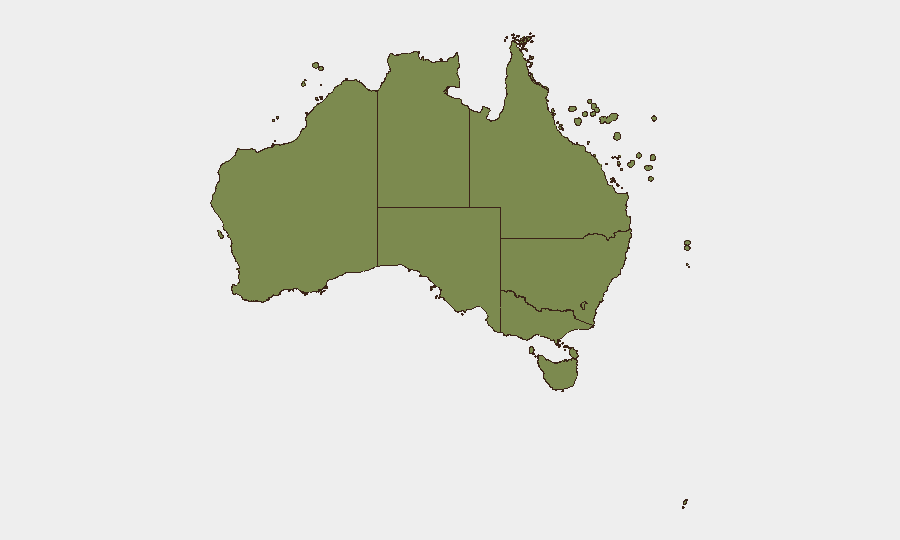
New South Wales (31.2) is the dominant risk driver, with a composite score nearly 3.7× higher than the national average and substantially above all other states. The Northern Territory (18.5) ranks second but at half NSW's level, indicating concentrated rather than distributed risk. ACT, Victoria, and Queensland remain in single-digit ranges. NSW's elevated profile likely reflects Sydney metropolitan density, police activity, and political/institutional events; corporate teams with offices, supply chains, or personnel in NSW should maintain heightened situational awareness. The gap between NSW and other states suggests either genuine localization of threat activity or concentration of event reporting and monitoring in that jurisdiction.
How GeoBit Would Assist
Security and duty-of-care teams should deploy persistent Area-of-Interest (AOI) monitoring on NSW metro regions and key infrastructure nodes, with automated alerting on police, civil unrest, and small-arms signals. Intel Sweep and X/Twitter OSINT on police and opposition political accounts, plus early-warning prediction on escalation risk, would provide 48–72 hour lead time on institutional friction. Routing & Network Analysis can identify alternative supply-chain and personnel-movement paths if specific incidents (police operations, armed confrontation) spike in key Sydney/NSW corridors.
7-Day Outlook
Domestic political and police activity is likely to persist over the next week, particularly around the Opposition statements and ongoing investigations flagged in the event signals. No imminent national-level security breakdown is indicated, but localized friction in NSW may generate short-term disruption to operations or travel. Continued monitoring of police statements, political communications, and ABC reporting will clarify the nature and severity of the "Conventional Military Force" and small-arms signals currently opaque in available data.
Highest-Risk Areas — Ranked
| # | State / Region | Risk |
|---|---|---|
| 1 | New South Wales | 31.2 |
| 2 | Northern Territory | 18.5 |
| 3 | Australian Capital Territory | 8.4 |
| 4 | Victoria | 7.4 |
| 5 | Queensland | 6.8 |
| 6 | Western Australia | 5.3 |
| 7 | South Australia | 3.6 |
| 8 | Tasmania | 3 |
| 9 | Ashmore and Cartier Islands | 1.2 |
| 10 | Jervis Bay Territory | 1.2 |
| 11 | Coral Sea Islands | 1.2 |
Sources
Previous Daily Briefs
A new Australia brief is written every day — each with its own risk map and downloadable CSV. Here's the last week; use the calendar to go further back.
📅 Browse every day by calendar →
Highlighted days have a brief. Tap a day for that day's map & analysis, or “csv” for that day's dataset ($5).