Situation Summary
Congo (Republic of Congo and Democratic Republic of Congo) presents a fragmented threat landscape with high concentration of risk in western/southwestern regions and ongoing health-security pressures in the east. As of 23 June 2026, open-source reporting does not confirm specific security or unrest incidents within the last 24–48 hours; however, recent military activity signals and cross-border health emergencies (notably Ebola in eastern DRC as of mid-June) remain operative. Risk trajectory depends on containment of outbreak dynamics and stability of armed-group activity in Cuvette-Ouest and Niari departments.
Key Developments
No verified security or civil unrest incidents specific to 21–23 June 2026 are currently documented in accessible open sources. Platform signals (event feeds, OSINT) include tagged military and small-arms activity dated 23 June, but lack geographic specificity, corroborating narrative detail, or independent sourcing necessary for a security brief.
Background context (within last ~2 weeks, for situational awareness):
- Eastern DRC (Ituri, North Kivu): As of 18–21 June, Ebola (Bundibugyo) surge documented in Bunia and Mambasa (Ituri) with confirmed cases on 18–19 June; displacement from armed conflict reported in Walikale and Masisi (North Kivu) on 20–21 June; Uganda–DRC border tightening at Kasindi/Mpondwe axis (20–21 June) in response to outbreak.
- Health & Movement Restrictions: Uganda suspended flights and heightened border screening as of 20–21 June; Ebola outbreak classified Status RED for travel risk.
Critical limitation: Event-level incidents for Congo proper dated 21–23 June require additional source corroboration before inclusion in operational briefing.
Highest-Risk Areas
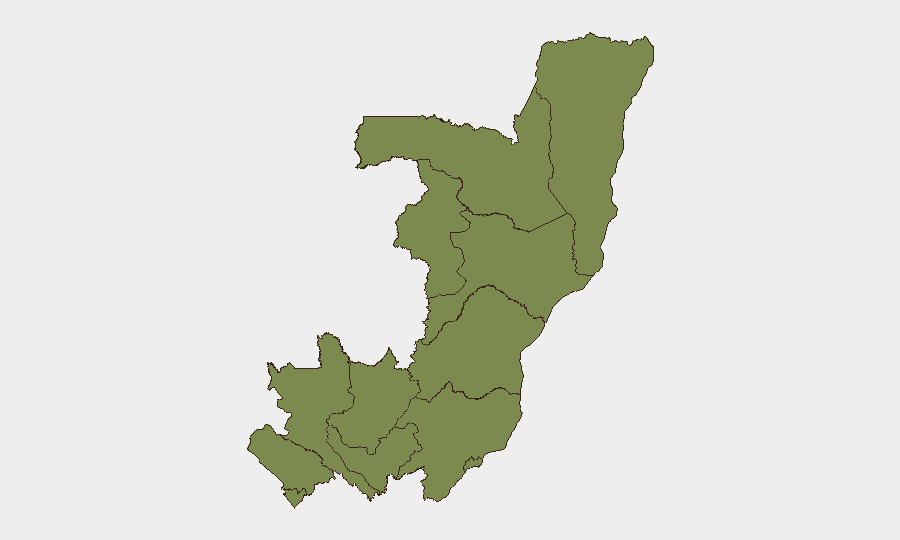
Cuvette-Ouest Department (risk score 31.3) and Niari Department (risk score 22.4) together account for the majority of tracked threat concentration in Congo, driven by armed-group presence and periodic conventional military engagement. Brazzaville, the capital, carries substantially lower risk (2.6) but remains a hub for downstream effects of regional instability, including displacement and resource pressure. All other departments score uniformly low (1.3), indicating either lower baseline volatility or reduced reporting density.
How GeoBit Would Assist
Security and risk teams operating in or resourcing Congo should prioritize AOI (Area-of-Interest) Monitoring & Early Warning for Cuvette-Ouest, Niari, and the Uganda–DRC border corridor (Ituri/Kasindi axis) to detect escalation in armed activity or outbreak spread in near-real time. Conflict & Military force-structure and weapons-capability tracking, combined with Network & Actor Analysis of armed groups active in western Congo, enable operational teams to forecast movement and assess threat trajectory to corporate assets. Environmental & Health monitoring (linked to Ebola and humanitarian access constraints) supports duty-of-care planning for personnel in DRC's eastern provinces and cross-border zones.
7-Day Outlook
Expect continued low-intensity armed activity in Cuvette-Ouest and Niari absent major political or resource-competition shifts; outbreak containment in eastern DRC will remain the primary non-conflict threat driver through early July. Corporate and field teams should assume restricted mobility in Ituri and North Kivu through at least week of 30 June pending Ebola trajectory confirmation. Monitoring for secondary effects (refugee movement, trade disruption, NGO access constraints) in border regions and Brazzaville warranted.
Highest-Risk Areas — Ranked
| # | State / Region | Risk |
|---|---|---|
| 1 | Cuvette-Ouest Department | 31.3 |
| 2 | Niari Department | 22.4 |
| 3 | Brazzaville (department) | 2.6 |
| 4 | Sangha | 1.3 |
| 5 | Likouala | 1.3 |
| 6 | Cuvette Department | 1.3 |
| 7 | Kouilou Department | 1.3 |
| 8 | Pointe-Noire (département) | 1.3 |
| 9 | Lékoumou Department | 1.3 |
| 10 | Bouenza Department | 1.3 |
| 11 | Plateaux Department | 1.3 |
| 12 | Pool Department | 1.3 |
Sources
Previous Daily Briefs
A new Congo brief is written every day — each with its own risk map and downloadable CSV. Here's the last week; use the calendar to go further back.
📅 Browse every day by calendar →
Highlighted days have a brief. Tap a day for that day's map & analysis, or “csv” for that day's dataset ($5).