Situation Summary
India's composite threat score of 72 places it at rank #17 globally, with 1,805 tracked events reflecting persistent demand-based activism, political friction, and localized unrest signals. Recent signal activity (18–19 June) includes community demands, legislative pressure, and rebellion-related threats, though open-source verification of specific incidents within the last 24–48 hours remains incomplete. The threat landscape is driven by sub-national volatility rather than a single national crisis; Maharashtra, Delhi, and Uttar Pradesh account for the highest-risk concentrations. No major infrastructure disruption or casualty-generating events have been confirmed in mainstream or OSINT feeds for the immediate past two days.
Key Developments
- Signal: Community & Legislative Demands (18–19 June). Unverified reports of demand-based activism and parliamentary pressure detected; location and specific grievances require ground-truth confirmation via live social media and wire services.
- Signal: Rebellion-Related Threat (18 June). Loosely attributed threat language flagged; lacks geo-specific corroboration, casualty estimates, or operational detail.
- Signal: Public Disapproval — Delhi vs. Government (18 June). Sentiment friction between New Delhi constituencies and central/state governance detected; no confirmed demonstrations, road closures, or violence reports yet.
- Signal: Police-Related Sentiment (17 June). Disapproval language noted; insufficient detail on location, trigger, or operational impact.
- Signal: Military Activity — Sikkim (17 June). Conventional military force activity registered; context (routine exercise vs. escalation) and scale unconfirmed.
Important caveat: All items above are signal-level detections pending verification. No time-stamped incident reports (attacks, riots, significant disruptions) within Indian territory were independently corroborated in the last 24–48 hours from major news wires, India-focused security outlets, or OSINT feeds.
Highest-Risk Areas
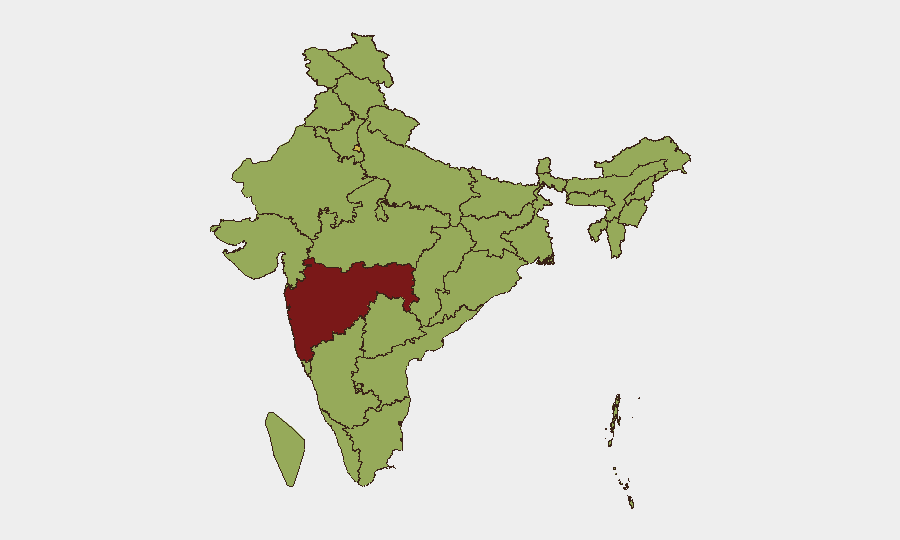
Maharashtra (80.7) and Delhi (66.9) dominate the risk profile, driven by high population density, economic concentration, and recurring patterns of labor unrest, political activism, and communal friction. Uttar Pradesh (58.7) and Karnataka (58.4) register elevated composite scores reflecting periodic demand-based protests and localized law-enforcement volatility. Jammu and Kashmir (57.8) remains elevated due to long-standing civil-security asymmetries and cross-border attention. Organizations with personnel or critical infrastructure in these five states should prioritize real-time local intelligence, staff briefing on civic calendars (elections, legislative sessions, festivals), and contingency routing.
How GeoBit Would Assist
Security teams should activate Intel Sweep and multi-language OSINT (X/Twitter, Telegram, local news wires) to establish ground truth on the unverified signals above—especially location, timeline, and operational scope. AOI Monitoring & Early Warning on Maharashtra, Delhi, and Uttar Pradesh would provide persistent, event-level alerting when demand-based activism or unrest escalates to disruption; Routing & Network Analysis supports real-time alternative-journey planning for personnel in high-risk states. Sentiment & Temporal Analysis can distinguish between routine political commentary and emerging unrest signals, reducing noise and false alarm.
7-Day Outlook
Near-term risk remains elevated but not acute. Demand-based activism and political friction are likely to persist, particularly in Maharashtra and Delhi; the Sikkim military signal warrants monitoring for any escalation indicators. Corporate security teams should expect normal operational friction (traffic delays from protests, localized curfews) rather than major security events, provided no triggering incident (communal violence, custodial death, major policy announcement) emerges unexpectedly.
Highest-Risk Areas — Ranked
| # | State / Region | Risk |
|---|---|---|
| 1 | Maharashtra | 80.7 |
| 2 | Delhi | 66.9 |
| 3 | Uttar Pradesh | 58.7 |
| 4 | Karnataka | 58.4 |
| 5 | Jammu and Kashmir | 57.8 |
| 6 | Madhya Pradesh | 55.8 |
| 7 | Tamil Nadu | 54.6 |
| 8 | Bihar | 54.6 |
| 9 | West Bengal | 54.1 |
| 10 | Haryana | 53.6 |
| 11 | Rajasthan | 53 |
| 12 | Gujarat | 52.4 |
Previous Daily Briefs
A new India brief is written every day — each with its own risk map and downloadable CSV. Here's the last week; use the calendar to go further back.
📅 Browse every day by calendar →
Highlighted days have a brief. Tap a day for that day's map & analysis, or “csv” for that day's dataset ($5).