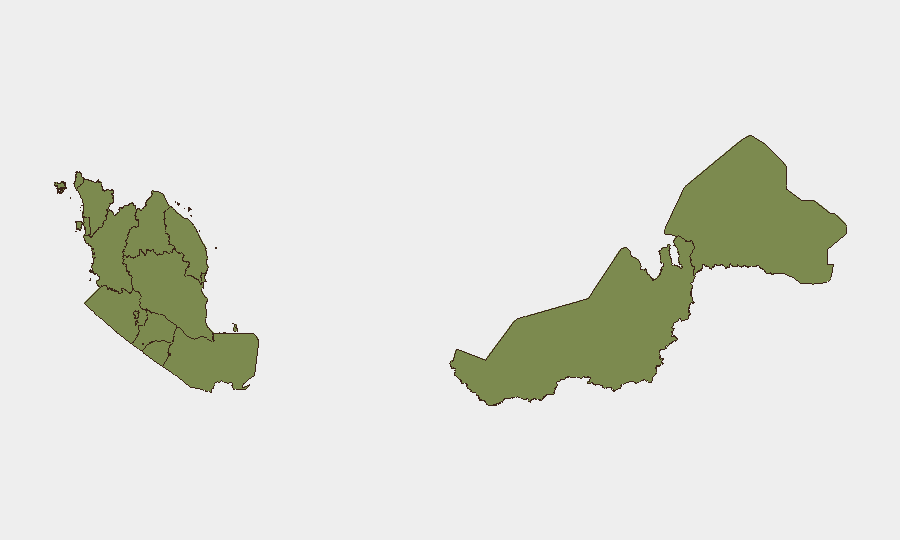
Situation Summary
Malaysia remains a stable, lower-threat environment globally (rank #167, composite score 4.0), with no major security incidents confirmed in the past 24–48 hours. Recent signal activity reflects routine political discourse, public statements by government and academic actors, and isolated disapproval events rather than organized violence or systemic unrest. The security posture remains consistent with Malaysia's long-term profile: administratively resilient, but with persistent sub-regional vulnerabilities concentrated in Johor.
Key Developments
No corroborated, time-stamped security incidents have been confirmed in Malaysia within the last 24–48 hours via independent open-source reporting. The most recent GeoBit signal events (26–28 June) include:
- 2026-06-28 · Public Statement · Government / Academic / Citizen actors — Policy or institutional commentary; no security or unrest component identified in available reports.
- 2026-06-27 · Demand / Disapprove / Reduce Relations signals (Johor, Government, Community actors) — Low-intensity political or administrative friction; no incident details, casualties, or operational impact confirmed.
- 2026-06-26 · Conventional Military Force signal (Kuala Lumpur) — Source context and scope unconfirmed; routine training or posture adjustment cannot be ruled out pending corroboration.
- 2026-06-26 · Reject signal (Sarawak) — Administrative or policy disagreement; no security escalation evident.
Assessment: Available signals reflect political and institutional activity typical of Malaysia's normal operating environment. No credible reports of crime spikes, civil unrest, infrastructure failure, or travel impediments have surfaced in the past 48 hours.
Highest-Risk Areas
Johor dominates Malaysia's sub-national risk profile (31.8, representing 22% of tracked national threat events), driven by ongoing criminal networks, cross-border trafficking dynamics with Singapore, and occasional communal tensions. Kelantan (15.3) and Kuala Lumpur (12.5) contribute secondary risk through localized protest activity, petty crime, and administrative disputes. The remaining nine states score below 9.0, with significant clustering in Selangor and Pahang (both 2.9) and minimal threat in Perlis, Kedah, Penang, and Perak (all <2.0). Risk concentration in Johor reflects its strategic position and cross-border exposure; corporate operations and supply chains in that state warrant elevated monitoring cadence and contingency planning relative to other regions.
How GeoBit Would Assist
Security teams should employ AOI Monitoring & Early Warning to establish persistent watches on Johor, Kelantan, and KL, with automated alerting on changes in protest signaling, law-enforcement activity, or cross-border trafficking patterns. Intel Sweep, multi-language OSINT, and X/Twitter/Telegram monitoring of Malaysian media, police channels, and local NGO networks provide real-time incident confirmation and localization. Routing & Network Analysis supports contingency planning for personnel and cargo movements in higher-risk corridors, while Conflict & Military tracking offers awareness of any force-posture changes affecting operational security.
7-Day Outlook
No escalation indicators are visible in the current signal environment. Routine political and administrative activity is expected to continue. Security teams should maintain standard monitoring protocols for Johor and monitor official statements from the National Security Council and PDRM for any changes in threat guidance; barring significant new intelligence, Malaysia's risk posture is unlikely to shift materially over the next week.
Highest-Risk Areas — Ranked
| # | State / Region | Risk |
|---|---|---|
| 1 | Johor | 31.8 |
| 2 | Kelantan | 15.3 |
| 3 | Kuala Lumpur | 12.5 |
| 4 | Sarawak | 8.5 |
| 5 | Sabah | 6.8 |
| 6 | Selangor | 2.9 |
| 7 | Pahang | 2.9 |
| 8 | Terengganu | 2.3 |
| 9 | Perlis | 1.8 |
| 10 | Kedah | 1.8 |
| 11 | Penang | 1.8 |
| 12 | Perak | 1.8 |
Sources
Previous Daily Briefs
A new Malaysia brief is written every day — each with its own risk map and downloadable CSV. Here's the last week; use the calendar to go further back.
📅 Browse every day by calendar →
Highlighted days have a brief. Tap a day for that day's map & analysis, or “csv” for that day's dataset ($5).