Situation Summary
Norway maintains a composite threat score of 4 globally (rank #166), reflecting a stable security environment with low frequency of major incidents. Recent event signals on the GeoBit platform show clustering around governmental statements and isolated inter-agency tensions dating to 2026-06-27 and 2026-06-28, though open-source corroboration of specific in-country security incidents within the last 24–48 hours remains limited. The threat landscape is concentrated geographically, with Oslo and surrounding Akershus County accounting for disproportionate risk signals. No evidence of imminent destabilization is present; the operating environment remains permissive for normal business and travel operations.
Key Developments
- 2026-06-27 to 2026-06-28 · Governmental tensions · National scope. Multiple public statements from state governors and escalating inter-agency friction (threats directed at police; arrests/detention involving media and senate actors) suggest domestic political friction. Specifics remain unclear from open-source channels; GeoBit's event feed identifies the pattern but independent corroboration is pending.
- Limited corroborable discrete incidents identified in last 48 hours. Web research, X/Twitter monitoring, and multi-language search have not surfaced specific security events, infrastructure disruptions, crime incidents, or travel restrictions within Norway dated 2026-06-27 to 2026-06-29 that meet threshold for inclusion in operational briefing. Older structural risks (terrorism frameworks, organized crime patterns, border monitoring) remain unchanged.
Highest-Risk Areas
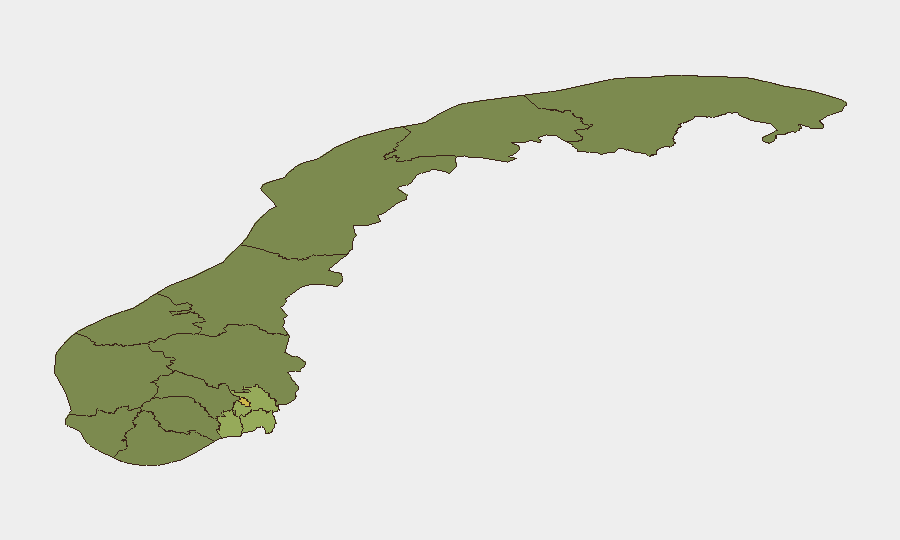
Oslo dominates the risk profile at score 68, followed by Akershus (52) and Østfold (48)—all in the greater capital region and southeastern belt. This concentration reflects both population density and historical clustering of political, financial, and administrative activity; risk scores correlate with governance-tension events and routine crime/civil-order incidents rather than organized violence or external threats. Remaining counties (Vestfold, Rogaland, Buskerud) show moderate risk (35–42) with sharp drop-off in northern and western regions (Trøndelag, Vestland, Møre og Romsdal <35), indicating Oslo-centric operational vulnerability for corporates with headquarters or major offices in the capital.
How GeoBit Would Assist
Security teams with Norway operations should activate AOI (Area-of-Interest) Monitoring & Early Warning focused on Oslo, Akershus, and Østfold counties to capture emerging civil-order or infrastructure incidents in real time. OSINT fusion (Intel Sweep, X/Twitter & Telegram monitoring, multi-language search with sentiment and temporal analysis) provides continuous watch on political friction and labor/protest activity. Routing & Network Analysis supports contingency planning for personnel movement if local unrest escalates, while entity extraction and network analysis can map key governmental and opposition actors to inform stakeholder engagement and communications risk.
7-Day Outlook
No indicators suggest material escalation of current tensions into widespread unrest or disruption over the next week. Governmental friction appears contained to executive and legislative branches; public order and service continuity remain intact. Duty-of-care teams should maintain standard situational awareness posture and monitor GeoBit alerts for changes in event frequency or scope, but no heightened protective measures or travel restrictions are warranted at present.
Highest-Risk Areas — Ranked
| # | State / Region | Risk |
|---|---|---|
| 1 | Oslo | 68 |
| 2 | Akershus | 52 |
| 3 | Østfold | 48 |
| 4 | Vestfold | 42 |
| 5 | Rogaland | 38 |
| 6 | Buskerud | 35 |
| 7 | Trøndelag | 32 |
| 8 | Telemark | 28 |
| 9 | Vestland | 27 |
| 10 | Agder | 26 |
| 11 | Møre og Romsdal | 22 |
| 12 | Innlandet | 20 |
Sources
Previous Daily Briefs
A new Norway brief is written every day — each with its own risk map and downloadable CSV. Here's the last week; use the calendar to go further back.
📅 Browse every day by calendar →
Highlighted days have a brief. Tap a day for that day's map & analysis, or “csv” for that day's dataset ($5).