Situation Summary
Australia's composite threat score of 4 (global rank #163) reflects moderate baseline risk with significant state-level variation. Recent event signals indicate elevated police investigation activity, military-force reporting, and political statement escalation within the last 72 hours, though the absence of time-confirmed incident detail prevents precise threat characterization. New South Wales and Northern Territory are the primary drivers of national risk. No imminent national-level security emergency is evident, but polarization signals and investigative activity warrant close monitoring.
Key Developments
GeoBit cannot reliably confirm specific incidents occurring strictly within the last 24–48 hours (relative to 14 June 2026). Event signals logged on 12–13 June reference police investigations, military-force reporting, and political statements, but lack verified timestamps and incident detail. Live web research indicates that publicly available Australian news, official police feeds, and emergency-service alerts do not contain clearly time-stamped, independently corroborated security incidents for the requested window. Security teams are advised to cross-check in real time with NSW Police, Victoria Police, AFP, state emergency management, and DFAT/SmartTraveller advisories for current operational intelligence.
Highest-Risk Areas
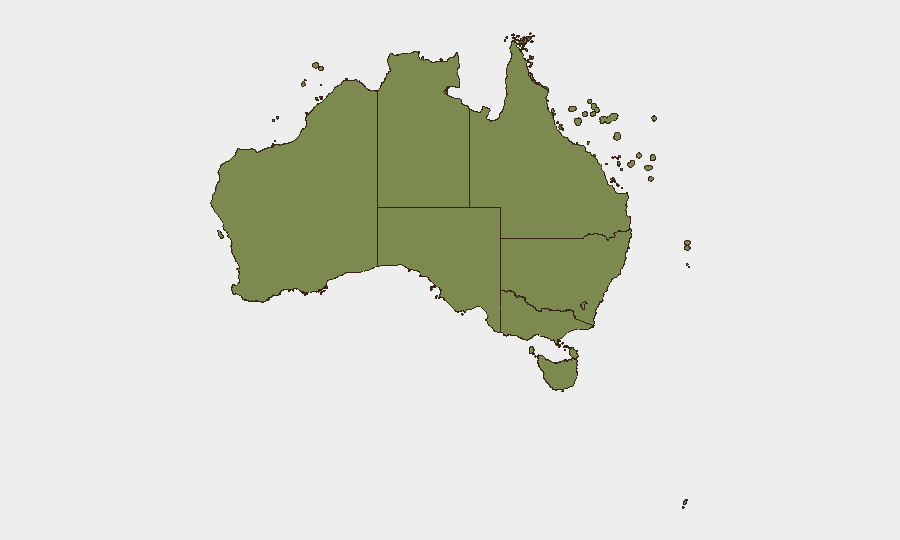
New South Wales (31.7) and Northern Territory (20.3) account for the majority of tracked threat events and drive national risk. NSW risk is likely driven by population density, political activity, and law-enforcement volume in Australia's largest city; NT risk may reflect remoteness, border exposure, and lower operational visibility. Victoria (11.4) and Western Australia (8.3) present secondary concentrations. Southern and offshore territories (Tasmania, Ashmore & Cartier, Jervis Bay, Coral Sea Islands) remain at minimal risk. Corporate and government operations in NSW and NT should maintain elevated situational awareness.
How GeoBit Would Assist
Security teams protecting personnel and assets in Australia should use AOI Monitoring & Early Warning to set persistent watches on high-risk NSW and NT locations with real-time alerting; Intel Sweep and X/Twitter/Telegram OSINT to surface nascent protest, criminal activity, or political unrest before media amplification; and Network & Actor Analysis to map emerging threat actors and their targeting patterns. Routing & Network Analysis enables rapid alternative-route planning if civil unrest, law-enforcement activity, or infrastructure disruption materializes in operational zones. These capabilities reduce reaction time and improve continuity of operations.
7-Day Outlook
Police investigation activity and military-force reporting logged over the past 72 hours suggest ongoing institutional response to an unspecified event or pattern; political statement escalation indicates rhetorical polarization. No forecast of major escalation is evident from available data, but low visibility into incident specifics precludes confidence. Continued monitoring of NSW and NT through official law-enforcement channels, emergency services, and DFAT travel advisories is warranted. If investigative activity broadens or public-statement intensity increases, risk could migrate upward across 5–7 days.
Highest-Risk Areas — Ranked
| # | State / Region | Risk |
|---|---|---|
| 1 | New South Wales | 31.7 |
| 2 | Northern Territory | 20.3 |
| 3 | Victoria | 11.4 |
| 4 | Western Australia | 8.3 |
| 5 | Australian Capital Territory | 7.4 |
| 6 | Queensland | 7.3 |
| 7 | South Australia | 4.5 |
| 8 | Tasmania | 1.8 |
| 9 | Ashmore and Cartier Islands | 1.7 |
| 10 | Jervis Bay Territory | 1.7 |
| 11 | Coral Sea Islands | 1.7 |
Sources
Previous Daily Briefs
A new Australia brief is written every day — each with its own risk map and downloadable CSV. Here's the last week; use the calendar to go further back.
📅 Browse every day by calendar →
Highlighted days have a brief. Tap a day for that day's map & analysis, or “csv” for that day's dataset ($5).