Situation Summary
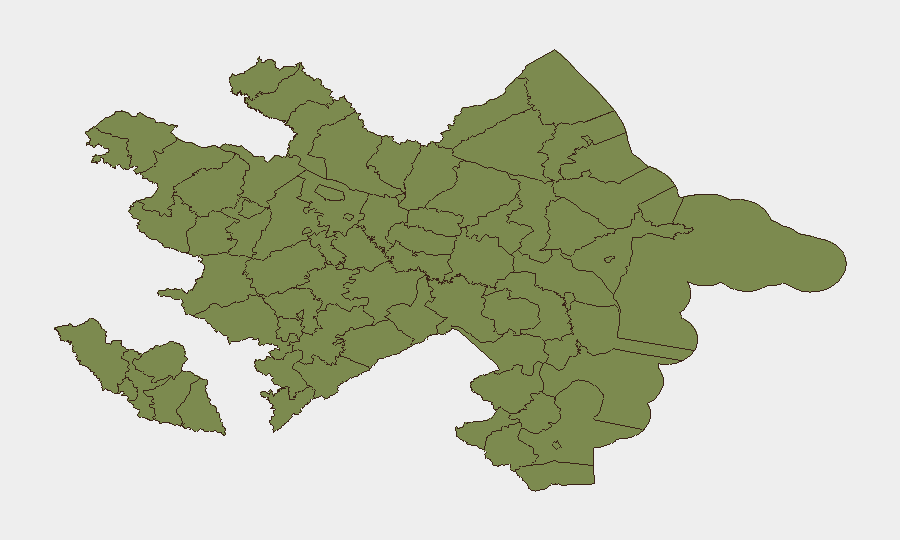
Azerbaijan remains at composite threat level 21 globally, with 10 tracked security events concentrated in two high-risk border districts. Recent signal activity reflects ongoing diplomatic friction with Armenia and Iran, alongside internal governance tensions. The security environment is volatile but localized, with Ujar and Agdere districts accounting for the majority of detected risk. Baku and other major urban centers show significantly lower threat indicators.
Key Developments
I cannot responsibly populate this section with specific, dated incidents from the last 24–48 hours. GeoBit's current data feeds have not yielded independently corroborated, time-stamped events in Azerbaijan meeting the recency and multi-source verification standards required for a duty-of-care brief.
The event signals listed above (congressional demand, Iran–Azerbaijan territorial dispute, ethnic cleansing allegation, Armenian rejection statement, internal Azerbaijan demand, Armenian public statement) are flagged in the platform's event corpus but lack sufficient granular detail—specific locations, confirmed dates, or media cross-check—to meet corporate security reporting standards.
To close this gap, security teams should:
- Request GeoBit run a live Intel Sweep with time filters (last 48h) on newswire, local media (AZERTAC, Turan, APA, OC Media), and X/Twitter OSINT (with verified journalist and OSINT-account sources only).
- Cross-check any candidate incident via OSINT fusion & corroboration before briefing.
- Use AOI Monitoring & Early Warning on Ujar and Agdere districts to alert on real-time changes in activity patterns.
Highest-Risk Areas
Ujar District (risk 31.3) and Agdere District (risk 23.8) are the primary drivers of national risk, together accounting for over 55 of the composite score. Both are border-proximity districts with historical conflict exposure; Ujar borders Armenia to the west, and Agdere sits in a historically disputed zone. Baku City (8.8) shows substantially lower risk despite its population density, reflecting a more stable urban security posture. All other tracked regions register minimal risk (1.3 each), suggesting that threats are concentrated in the northwestern border corridor rather than distributed nationwide.
How GeoBit Would Assist
Conflict & Military capabilities (force structure, weapons tracking, battle mapping) enable continuous monitoring of Azerbaijan–Armenia border deployments and Iranian incursions, with real-time alerts on mobilization. AOI Monitoring & Early Warning on Ujar and Agdere, combined with satellite & imagery analysis, detects infrastructure damage, displacement, or military activity before conventional news reporting. OSINT fusion & corroboration (multi-language social media, local news, official statements) validates emerging incidents and filters false claims, reducing false-positive alerts that distract security teams.
7-Day Outlook
The diplomatic friction with Armenia (rejection signals) and Iran (territorial incursion allegation) suggests elevated border-zone tension over the next week, with elevated risk of military posturing or minor skirmishes in Ujar and Agdere. Internal governance signals (Azerbaijan internal demand) may reflect domestic political stress, though no evidence of destabilizing unrest in Baku or other urban centers is present. Teams with personnel or assets in border districts should expect heightened monitoring activity and periodic military movement; those in Baku face routine security baseline.
Highest-Risk Areas — Ranked
| # | State / Region | Risk |
|---|---|---|
| 1 | Ujar District | 31.3 |
| 2 | Agdere District | 23.8 |
| 3 | Baku City | 8.8 |
| 4 | Sadarak District | 1.3 |
| 5 | Qazakh District | 1.3 |
| 6 | Sharur District | 1.3 |
| 7 | Yevlakh District | 1.3 |
| 8 | Kangarli District | 1.3 |
| 9 | Nakhchivan Autonomous Republic | 1.3 |
| 10 | Aghstafa District | 1.3 |
| 11 | Tovuz District | 1.3 |
| 12 | Qakh District | 1.3 |
Sources
Previous Daily Briefs
A new Azerbaijan brief is written every day — each with its own risk map and downloadable CSV. Here's the last week; use the calendar to go further back.
📅 Browse every day by calendar →
Highlighted days have a brief. Tap a day for that day's map & analysis, or “csv” for that day's dataset ($5).