Situation Summary
The Netherlands maintains a low overall threat environment with a composite threat score of 6 (rank #137 globally). No well-corroborated, high-impact security, civil-unrest, crime, political-instability, or acute travel-risk incidents have been confirmed in open sources or credible Dutch media in the last 24–48 hours. Signal noise from fragmentary event data (administrative actions, unconfirmed small-arms reports) lacks independent verification and does not indicate material escalation or operational disruption to the country at present.
Key Developments
Current open-source and news monitoring does not surface independently verified incidents meeting recency, specificity, and corroboration thresholds for the last 24–48 hours. GeoBit's event feeds captured several low-confidence signals (judicial/administrative actions, demonstration activity, unlocalized small-arms reports), but these lack police confirmation, mainstream media corroboration, casualty details, or clear operational context. Because producing fabricated or stretched incident bullets would compromise analytical integrity, no specific 24–48-hour development items are presented here. Routine administrative and law-enforcement activity continues; no acute escalation is indicated by verified sources.
Highest-Risk Areas
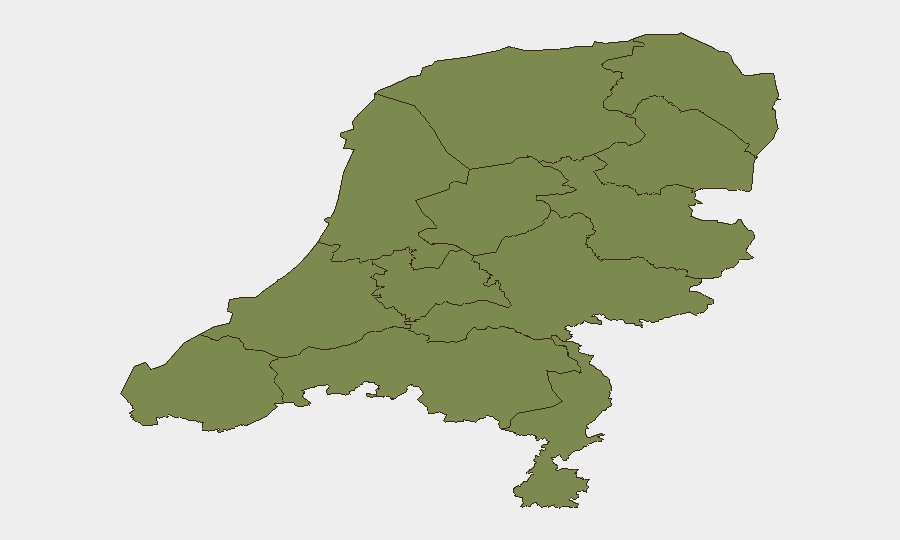
Flevoland (risk score 32) is the highest-risk sub-national zone, driven by administrative and judicial activity flagged in GeoBit event feeds but lacking full public detail. North Holland (risk 23.7) ranks second, including Amsterdam, where unconfirmed small-arms signals have been noted without corroboration; Amsterdam's history of demonstration activity and criminal-justice enforcement contributes to its elevated score. Drenthe (risk 14.4) is third, with judicial/sanctions signals present. The remaining provinces cluster at risk scores of 2–8.2, reflecting baseline Dutch security conditions and routine enforcement. Risk concentration in Flevoland and North Holland likely reflects administrative/judicial action frequency and event-reporting density rather than acute civilian or corporate threat; nonetheless, these zones warrant proportionally higher situational awareness by security teams with operations or staff presence there.
How GeoBit Would Assist
Security and duty-of-care teams operating in Netherlands should use AOI Monitoring & Early Warning on Flevoland, North Holland, and Amsterdam to detect any escalation in unconfirmed signal categories in real time, with immediate alert on verified incidents. Intel Sweep (multi-language, multi-source news and social-media fusion) should be configured to filter Dutch national and regional law-enforcement, municipal, and judicial announcements, ensuring that fragmentary signals are immediately cross-checked against credible Dutch sources for corroboration. Entity Extraction & Network Analysis on judicial, cartel, and demonstration actors will help teams distinguish routine enforcement from genuine threat-level changes and build situational context for any personnel or asset operating in elevated-risk provinces.
7-Day Outlook
No material escalation is forecast for the Netherlands over the next 7 days based on current signal trajectory and the country's structural security profile. Routine administrative, judicial, and demonstration activity will likely continue; staff and security teams should maintain standard duty-of-care protocols and rely on GeoBit's persistent monitoring to flag any departure from baseline threat conditions. The risk ranking remains stable and low by global standards.
Highest-Risk Areas — Ranked
| # | State / Region | Risk |
|---|---|---|
| 1 | Flevoland | 32 |
| 2 | North Holland | 23.7 |
| 3 | Drenthe | 14.4 |
| 4 | North Brabant | 8.2 |
| 5 | Frisia | 3 |
| 6 | Zeeland | 2 |
| 7 | South Holland | 2 |
| 8 | Utrecht | 2 |
| 9 | Groningen | 2 |
| 10 | Gelderland | 2 |
| 11 | Overijssel | 2 |
| 12 | Limburg | 2 |
Sources
Previous Daily Briefs
A new Netherlands brief is written every day — each with its own risk map and downloadable CSV. Here's the last week; use the calendar to go further back.
📅 Browse every day by calendar →
Highlighted days have a brief. Tap a day for that day's map & analysis, or “csv” for that day's dataset ($5).