Situation Summary
Uruguay remains at low global threat rank (#165) but faces an acute localized security crisis in Montevideo driven by organized-crime violence. Homicides rose 6.6% in the first half of 2026, with gang conflict concentrated in western neighborhoods. The government has deployed military armored vehicles under police command to high-crime zones as an emergency measure, signaling escalation in both threat and response intensity. The trajectory is one of rising violence in a single metropolitan area rather than nationwide instability.
Key Developments
- Montevideo, Zona Oeste — 2026-07-27 — The Ministry of Interior confirmed the Cóndor armored vehicle is now operational for patrols after mechanical failure grounded it on its first deployment day.
- Montevideo — 2026-07-26 — The same Cóndor vehicle suffered multiple mechanical defects during initial patrol, including air-hose failures, oil leaks, fuel-cabin odor, and handbrake malfunction, forcing early withdrawal.
- Montevideo — 2026-07-26 to 2026-07-27 — The National Army deployed 12 Mamba MK-7 armored vehicles for patrol operations under police command in highest-crime neighborhoods as part of an anti-crime reinforcement operation.
- Montevideo, Parque Rodó — 2026-07-25 — A 12-year-old child was killed and five others wounded in a rambla shooting linked to narco-gang territorial conflict; officials connected the attack to organized-crime activity centered in Villa Española.
- Montevideo — 2026-07-27 — The Interior Ministry released first-half 2026 crime statistics showing homicides up 6.6%, while robberies, thefts, and vehicle thefts declined compared to same period 2025.
Highest-Risk Areas
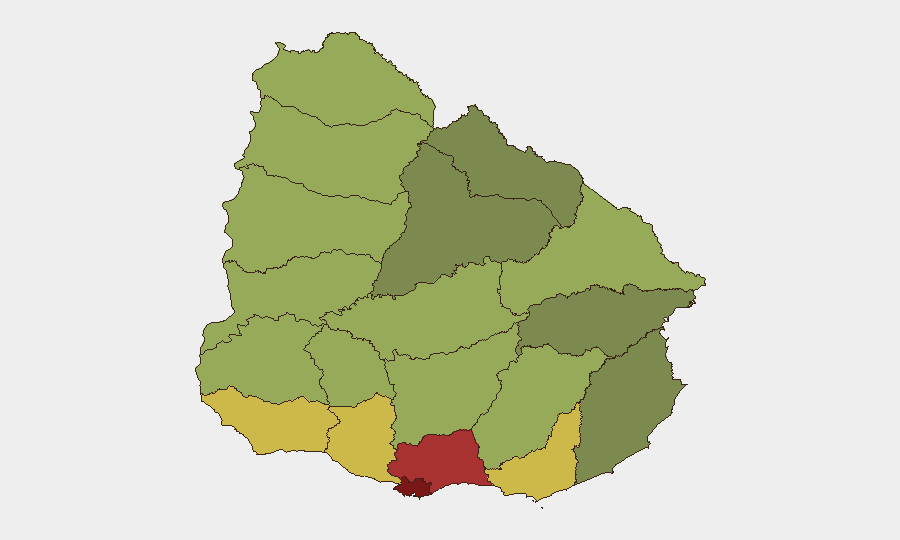
Montevideo dominates risk assessment (92/100), driven by active gang violence, recent homicides, and the current militarization of public security. Canelones (78) and Maldonado (68) follow, likely reflecting spillover trafficking routes and organized-crime supply chains feeding the metropolitan zone. San José, Colonia, and Soriano register moderate-to-elevated risk (50–64), consistent with inland and border-adjacent locations used for narcotics transit. Corporate security teams with personnel or operations in Montevideo's western neighborhoods face the highest duty-of-care exposure; operations in Canelones and along trafficking corridors warrant elevated travel and facility protocols.
How GeoBit Would Assist
Security teams should employ AOI Monitoring & Early Warning on Montevideo neighborhoods (Parque Rodó, Villa Española, Zona Oeste) to detect escalation or gang-conflict signals in real time. Network & Actor Analysis would map organized-crime groups involved in the current conflict, identify leadership and territorial claims, and track potential spillover into business districts or transportation hubs. OSINT fusion (X/Twitter, Telegram, local news) combined with sentiment & temporal analysis would flag emerging violence trends, police operations, or cartel announcements 24–48 hours ahead of street-level impact.
7-Day Outlook
Gang violence is likely to remain concentrated in Montevideo's western and central neighborhoods through early August; the military vehicle deployment may temporarily suppress visible street conflict but historically does not resolve underlying territorial disputes. Monitor for any escalation involving business districts, port facilities, or tourist zones (Maldonado coastal areas) as gangs seek to move operations or retaliate against police pressure. Border crossings in Colonia and Artigas may see increased trafficking volatility as criminal networks adapt to heightened enforcement in Montevideo.
Highest-Risk Areas — Ranked
| # | State / Region | Risk |
|---|---|---|
| 1 | Montevideo | 92 |
| 2 | Canelones | 78 |
| 3 | Maldonado | 68 |
| 4 | San José | 64 |
| 5 | Colonia | 62 |
| 6 | Soriano | 58 |
| 7 | Río Negro | 56 |
| 8 | Salto | 54 |
| 9 | Artigas | 52 |
| 10 | Paysandú | 50 |
| 11 | Florida | 48 |
| 12 | Flores | 46 |
Sources
Previous Daily Briefs
A new Uruguay brief is written every day — each with its own risk map and downloadable CSV. Here's the last week; use the calendar to go further back.
📅 Browse every day by calendar →
Highlighted days have a brief. Tap a day for that day's map & analysis, or “csv” for that day's dataset ($5).
Atlas — our AI intelligence desk — emails them this snapshot personally. Nothing else, no list.