Situation Summary
Singapore maintains a stable security posture with no credible reports of acute incidents, civil unrest, infrastructure disruption, or travel-risk events in the last 24–48 hours. The country ranks #122 globally (composite threat score 7) with 36 tracked events, reflecting low but monitored baseline risk. Recent developments centre on regulatory enhancements and political continuity rather than destabilizing events, with the security environment remaining conducive to normal business and residential operations.
Key Developments
- Nationwide, 29 June 2026 – Online Safety Commission reporting portal launch. Singapore's newly formed Online Safety Commission (OSC) began accepting reports of online harm—including harassment, doxxing, and related digital-security threats—via a dedicated public portal. This formalizes victim reporting channels and reflects regulatory adaptation to evolving cyber-harm vectors.
- Nationwide, late June 2026 – Singapore Police Force trials canine-mounted camera systems. The SPF Special Operations Command is conducting operational trials of live-video and thermal-imaging systems mounted on Police K-9 Unit dogs to enhance situational awareness during public-order and high-risk operations. This capability enhancement does not indicate an acute incident but signals evolving police operational doctrine.
- Nationwide, 29 June 2026 – Workers' Party retains Pritam Singh as party chief. Singapore's main opposition party confirmed continuity of leadership despite Pritam Singh's 2025 High Court conviction for false parliamentary testimony. No associated protests, civil unrest, or security incidents have been reported; the decision reflects political stability rather than factional instability.
Highest-Risk Areas
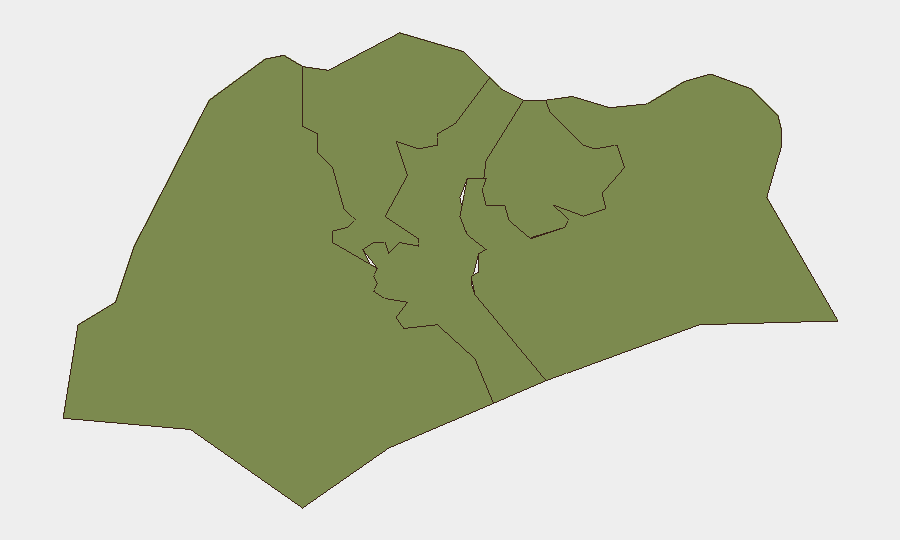
The Northwest region significantly outranks all others (risk score 31.5 vs. 2.4 for Central), driving the country's composite threat picture. The Central, Southwest, Northeast, and Southeast regions cluster at substantially lower risk (1.5–2.4), indicating concentrated vulnerability rather than distributed national exposure. The drivers of Northwest elevation warrant targeted monitoring; open reporting does not clarify whether this reflects historical incident density, border-adjacent vulnerability, or specific infrastructure exposure. Corporate teams with operations or personnel concentrated in the Northwest should maintain heightened situational awareness relative to other regions.
How GeoBit Would Assist
Security and risk teams covering Singapore would benefit from AOI Monitoring & Early Warning on the Northwest region to detect emerging civil, criminal, or operational developments before mainstream reporting; OSINT Sweep (multi-language, X/Telegram, sentiment analysis) to identify early signals of labour actions, policy changes, or reputational threats across political and digital-harm vectors; and Risk & Threat Assessment workflows tailored to sector-specific exposure (e.g., digital-services firms tracking online-safety regulatory escalation, or logistics/manufacturing assets in the Northwest). Election monitoring and regime-stability modules remain relevant for tracking opposition party dynamics and government policy shifts affecting business continuity.
7-Day Outlook
No imminent escalation is evident. The launch of the Online Safety Commission and SPF operational enhancements suggest regulatory and security-apparatus maturation rather than response to acute crises. Monitor the Northwest region for any clustering of incidents; track opposition-party developments and potential labour actions (suggested by recent public statements and lawyer strike signals in event data) for downstream duty-of-care implications. Baseline stable trajectory expected unless foreign-policy or internal political developments introduce volatility.
Highest-Risk Areas — Ranked
| # | State / Region | Risk |
|---|---|---|
| 1 | Northwest | 31.5 |
| 2 | Central | 2.4 |
| 3 | Southwest | 1.8 |
| 4 | Northeast | 1.5 |
| 5 | Southeast | 1.5 |
Sources
Previous Daily Briefs
A new Singapore brief is written every day — each with its own risk map and downloadable CSV. Here's the last week; use the calendar to go further back.
📅 Browse every day by calendar →
Highlighted days have a brief. Tap a day for that day's map & analysis, or “csv” for that day's dataset ($5).