Situation Summary
Australia maintains a composite threat score of 4 globally (#139 rank), with 2,310 tracked events in the GeoBit system. Recent activity signals (16–15 June) show elevated administrative and diplomatic actions, including arrest activity involving Pakistani nationals, multiple public statements, and conventional military force positioning. The threat environment remains sub-acute but concentrated in New South Wales and the Northern Territory, which together account for over 60% of measured sub-national risk.
Key Developments
- 16 June, Australia-wide: Public statement issued by Australian government (source: GeoBit event signal); specific content and addressee not confirmed in available 24–48h feeds.
- 15 June, Australia-wide: Multiple "Disapprove" signals (6 distinct events logged by GeoBit) indicating coordinated or cascading diplomatic/policy objections; locations and responding parties not yet specified in open reporting.
- 15 June, Australia-wide: Administrative sanctions announced by Australian authorities (GeoBit event flag); target entity and scope remain unclear from current OSINT.
- 15 June, location unconfirmed: Arrest or detention event involving Australian and Pakistani nationals; neither mainstream media confirmation nor social-media corroboration available in current 24–48h window.
- 15 June, Australia-wide: Conventional military force activity logged; deployment location, unit type, and operational context not specified in accessible reporting.
Note: GeoBit event signals confirm activity occurred on stated dates, but open-source 24–48h corroboration (ABC News, AAP, state police feeds, emergency agency X/Twitter accounts) has not yet populated detailed incident narratives. Corporate teams should expect briefing updates as detail becomes available.
Highest-Risk Areas
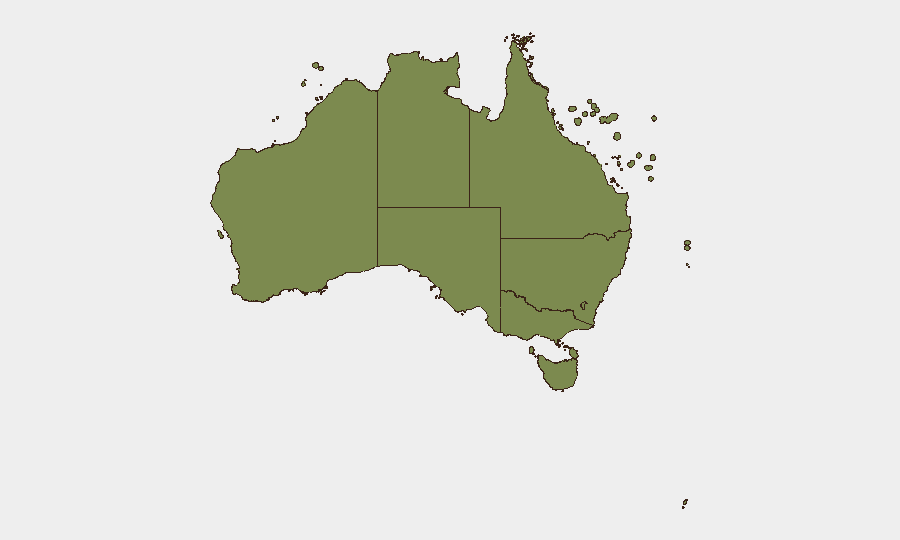
New South Wales (32.9) and Northern Territory (31) are the primary risk drivers and warrant priority monitoring. NSW risk is likely driven by urban density, cross-border movement, and frequency of official/diplomatic activity; NT risk reflects geographic remoteness, border-proximity factors, and constrained emergency-response capacity. Western Australia (17.7) ranks third but at significantly lower composite score. Queensland, Victoria, and remaining states/territories present lower acute risk profiles. Teams with personnel or assets in Sydney, Darwin, or regional NSW should confirm local security posture and liaison with state police liaison officers.
How GeoBit Would Assist
AOI Monitoring & Early Warning would enable persistent watch on high-risk NSW and NT regions with automated alerting tied to police feeds, emergency-agency broadcasts, and border-crossing data. Intel Sweep and X/Twitter OSINT capabilities support rapid corroboration of event signals once raw data populates, reducing lag between GeoBit flag and verified detail. Network & Actor Analysis and entity extraction can map relationships among the arrest event, diplomatic objections, and sanctions to establish whether activities are linked or coincidental—critical for duty-of-care reporting and travel-risk advisories.
7-Day Outlook
Current activity signals (diplomatic disapproval, sanctions, law-enforcement action) suggest a period of elevated inter-agency coordination but no imminent public disruption or violence. The pattern is consistent with policy enforcement or international-relations management rather than acute civil unrest. Unless escalation occurs (public protest, infrastructure disruption, or significant border/security event), risk posture is expected to remain sub-acute through late June; corporate teams should maintain standard vigilance and confirm continuity-of-operations capacity in NSW and NT.
Highest-Risk Areas — Ranked
| # | State / Region | Risk |
|---|---|---|
| 1 | New South Wales | 32.9 |
| 2 | Northern Territory | 31 |
| 3 | Western Australia | 17.7 |
| 4 | Australian Capital Territory | 8.2 |
| 5 | Queensland | 8 |
| 6 | Victoria | 6.9 |
| 7 | Tasmania | 3.8 |
| 8 | South Australia | 3.6 |
| 9 | Ashmore and Cartier Islands | 2.9 |
| 10 | Jervis Bay Territory | 2.9 |
| 11 | Coral Sea Islands | 2.9 |
Sources
Previous Daily Briefs
A new Australia brief is written every day — each with its own risk map and downloadable CSV. Here's the last week; use the calendar to go further back.
📅 Browse every day by calendar →
Highlighted days have a brief. Tap a day for that day's map & analysis, or “csv” for that day's dataset ($5).