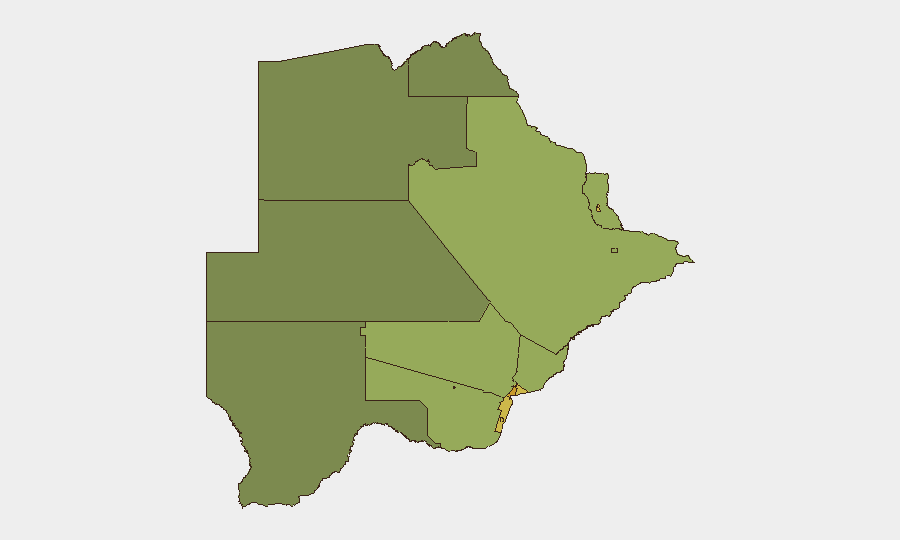
Situation Summary
Botswana maintains a low global threat profile (rank #164, composite score 7) with no tracked discrete security events in the current reporting window. The country's stability reflects relatively strong institutional capacity and low prevalence of organized conflict; however, sub-national concentrations of risk—particularly in Gaborone, South-East District, and Lobatse—warrant routine monitoring for crime, labor trafficking, and border-adjacent vulnerabilities. The security posture is stable, with no indicators of acute deterioration.
Key Developments
- Nationwide, 8 October 2026: Botswana authorities reportedly intercepted eight citizens allegedly being recruited into Russian military service at airports, in a coordinated operation with South African and Ethiopian counterparts. No independent confirmation of recruitment location(s) within Botswana or corroboration via social media has been established; the exact airport(s) involved remain unspecified.
- Nationwide, 9 October 2026: Botswana reportedly sought the repatriation of one citizen captured while fighting for Russia in Ukraine. No location within Botswana was identified, and no corroborating social-media reporting has surfaced.
- Gaborone, 12 October 2026: The Bank of Botswana raised P3.1 billion in what officials linked to improved fiscal conditions and lower anticipated borrowing requirements. This development signals relative economic stability rather than a discrete security incident.
- Nationwide, 13 October 2026: Botswana Police announced expanded community-engagement initiatives focused on crime prevention and gender-based violence awareness. No specific incident, location, or independent social confirmation accompanied the announcement.
Assessment: The week produced no confirmed localized security incidents, armed clashes, criminal events, or infrastructure disruptions meeting the threshold for discrete threat reporting. The two reports involving alleged military recruitment appear to lack geographic precision and independent corroboration necessary for operational threat assessment.
Highest-Risk Areas
Gaborone (risk 72), South-East District (68), and Lobatse (65) drive the country's sub-national risk profile and warrant prioritized monitoring. These three jurisdictions likely reflect concentrations of urban crime, economic-migrant vulnerability, cross-border movement (especially Gaborone's proximity to South Africa and Lobatse's border position), and labor-trafficking exposure. Mid-tier risk zones—Francistown, Jwaneng, and Selebi Phikwe—reflect mining and industrial activity that can correlate with labor disputes, informal-economy crime, and transient-population volatility. Northern and western districts exhibit substantially lower composite risk scores, consistent with sparser populations and reduced urban-crime drivers.
How GeoBit Would Assist
Security teams with personnel or assets in Botswana would benefit from AOI (Area-of-Interest) Monitoring & Early Warning focused on Gaborone, South-East District, and Lobatse to detect emerging crime patterns, border-crossing irregularities, or labor-trafficking signals before they escalate. Intel Sweep and OSINT fusion (X/Twitter, Telegram, local news, and social sentiment analysis) would provide real-time corroboration of unconfirmed reports—such as the military-recruitment claims—and filter out unsubstantiated allegations. Risk & Threat Assessment modules would allow duty-of-care teams to baseline and update exposure scores for specific facilities or personnel movements in high-risk sub-national zones.
7-Day Outlook
No significant security escalation is anticipated in the near term. Routine monitoring of Gaborone and border-adjacent districts (South-East, Lobatse) should continue, with particular attention to cross-border crime patterns and informal-labor recruitment networks. The next 7–14 days are unlikely to produce material changes to the current threat profile absent new localized incidents or regional spillover from South Africa.
Highest-Risk Areas — Ranked
| # | State / Region | Risk |
|---|---|---|
| 1 | Gaborone | 72 |
| 2 | South-East District | 68 |
| 3 | Lobatse | 65 |
| 4 | Francistown | 62 |
| 5 | Jwaneng | 61 |
| 6 | Selebi Phikwe | 58 |
| 7 | Southern District | 55 |
| 8 | Kgatleng District | 50 |
| 9 | Kweneng District | 48 |
| 10 | North-East District | 45 |
| 11 | Central District | 42 |
| 12 | North-West District | 38 |
Sources
Previous Weekly Briefs
A new Botswana brief is written every Monday, covering the week — each with its own risk map and downloadable CSV. Use the calendar to go further back.
- October 6, 2026
- September 29, 2026
- September 23, 2026
- September 16, 2026
- September 9, 2026
- September 3, 2026
- August 31, 2026
📅 Browse past briefs by calendar →
Highlighted days have a brief. Tap a day for that day's map & analysis, or “csv” for that day's dataset ($5).
Atlas — our AI intelligence desk — emails them this snapshot personally. Nothing else, no list.