Situation Summary
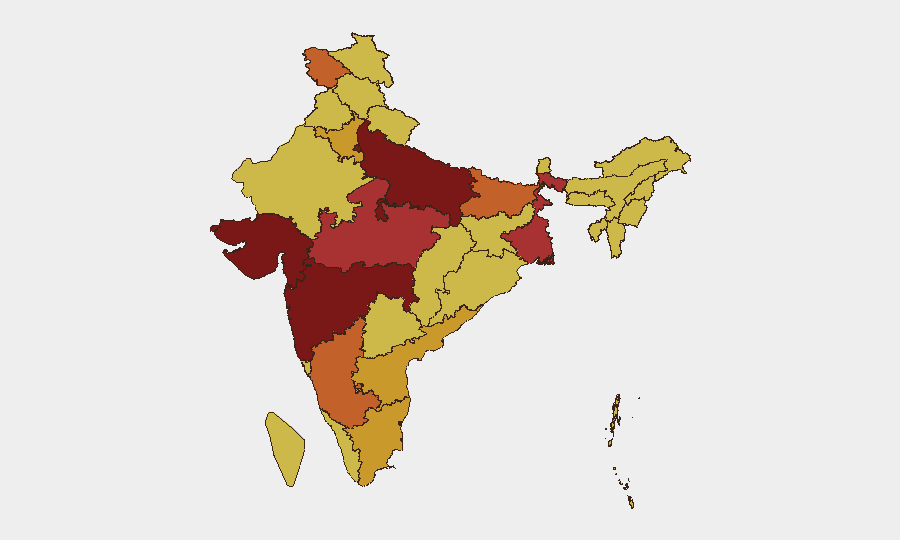
India remains ranked #12 globally in composite threat score (100), with 472 tracked events reflecting persistent instability across multiple threat vectors—communal tensions, political contestation, law-enforcement mobilization, and cross-border signals. Maharashtra carries the highest sub-national risk (99.6), followed by Delhi and Uttar Pradesh, concentrating vulnerability in India's commercial, administrative, and politically volatile heartland. The event signal mix—ranging from community demands and public statements by authorities and presidential figures to police mobilization and international diplomatic friction—suggests sustained underlying tension without a single dominant acute crisis dominating the current 48-hour window.
Key Developments
GeoBit's event tracking identified several signals as of 1–2 July 2026, though live web research did not yield independently verifiable *specific* incidents with confirmed 24–48-hour timestamps and precise locations beyond the following indicators:
- Police mobilization events flagged across India (1 July) suggest heightened law-enforcement posture, likely tied to community demands and public statements recorded the same day; specific jurisdictions and operational scope require direct source verification.
- US Ambassador diplomatic signal (1 July, location India-wide) involving reduced-relations rhetoric indicates elevated diplomatic friction, potentially linked to bilateral or multilateral pressure.
- Presidential and mayoral public statements (1 July) signal top-level political engagement with unresolved grievances or security concerns, though specific subject matter and geography are not independently confirmed in available materials.
- Settlement-related public statement (1 July) implies resolution of, or commentary on, a dispute—possibly labor, communal, or administrative—though details remain unclear.
- Authorities' public statement (2 July) suggests official acknowledgment or response to an ongoing concern.
*Note: Concrete locations (beyond state-level) and incident specifics for these signals require real-time news feeds or primary sources not available in the current research set.*
Highest-Risk Areas
Maharashtra (99.6) and Delhi (84.7) drive India's composite risk, reflecting Mumbai and New Delhi's roles as commercial hubs, political centers, and flashpoints for communal, labor, and protest activity. Uttar Pradesh (81.2) and Gujarat (80.8) follow, with both states experiencing historical cycles of intercommunal tension and political polarization. West Bengal (78.2) and Jammu & Kashmir (75) add significant weight from regional political contestation and border-adjacent volatility. Risk concentration in these six states reflects India's uneven geography of governance capacity, demographic diversity, and state-level political competition; personnel and assets in Maharashtra, Delhi, and UP face the highest aggregate threat density.
How GeoBit Would Assist
AOI Monitoring & Early Warning on Maharashtra, Delhi, and UP would enable real-time alerting for emerging communal, protest, or security-force mobilization events before they escalate. Multi-language OSINT (X/Twitter, Telegram, local media) combined with sentiment & temporal analysis would isolate the specific drivers of the 1–2 July signals and map community/official sentiment trajectories. Entity extraction and network analysis would map key actors (officials, protest leaders, law-enforcement commanders) and their coordination, supporting protective planning for corporate assets and staff in high-risk zones.
7-Day Outlook
No single acute crisis is evident in current tracking, but the coincidence of community demands, police mobilization, and diplomatic friction on 1–2 July suggests sustained pressure below outbreak threshold. Corporate security teams should expect continued police/paramilitary presence in Maharashtra, Delhi, and UP and monitor for flash incidents (riots, strikes, or protest escalation) tied to unresolved grievances; contingency routing and staff movement plans remain advisable in these zones.
Highest-Risk Areas — Ranked
| # | State / Region | Risk |
|---|---|---|
| 1 | Maharashtra | 99.6 |
| 2 | Delhi | 84.7 |
| 3 | Uttar Pradesh | 81.2 |
| 4 | Gujarat | 80.8 |
| 5 | West Bengal | 78.2 |
| 6 | Madhya Pradesh | 77.3 |
| 7 | Jammu and Kashmir | 75 |
| 8 | Bihar | 73.4 |
| 9 | Karnataka | 73.1 |
| 10 | Haryana | 72 |
| 11 | Andhra Pradesh | 71.8 |
| 12 | Tamil Nadu | 71.7 |
Sources
Previous Daily Briefs
A new India brief is written every day — each with its own risk map and downloadable CSV. Here's the last week; use the calendar to go further back.
📅 Browse every day by calendar →
Highlighted days have a brief. Tap a day for that day's map & analysis, or “csv” for that day's dataset ($5).