Situation Summary
The Netherlands remains a stable, low-threat operating environment with no significant security incidents, unrest, infrastructure failures, or travel disruptions reported in the last 24–48 hours. GeoBit's composite threat assessment ranks the country #152 globally with a score of 5/100, and live web research confirms all fragmentary event signals lack sufficient multi-source corroboration to meet professional incident-reporting standards. The security posture is characterized by routine administrative and law-enforcement activity with no acute escalation indicators.
Key Developments
- Countrywide (2026-06-30): Public statements by Dutch officials recorded; domestic investigation initiated but lacking confirmed details or location specificity in open sources.
- Countrywide (2026-06-30): Investigation activity flagged involving Dutch actors; nature and location unconfirmed in mainstream media.
- Countrywide (2026-06-30): Russian–Ukraine conflict threat signaling noted globally; no direct Netherlands-specific incident or operational impact confirmed.
- Regional (2026-06-28): Conventional military force activity reported between London and German actors; no Netherlands territory or asset involvement verified.
- Countrywide (2026-06-28): Deputy and entrepreneur public statements recorded; substantive details and security relevance unconfirmed in corroborated sources.
*Note: All signals above remain fragmentary and lack sufficient geographic precision, timing confirmation, or multi-source corroboration to constitute verified incidents affecting Netherlands operations.*
Highest-Risk Areas
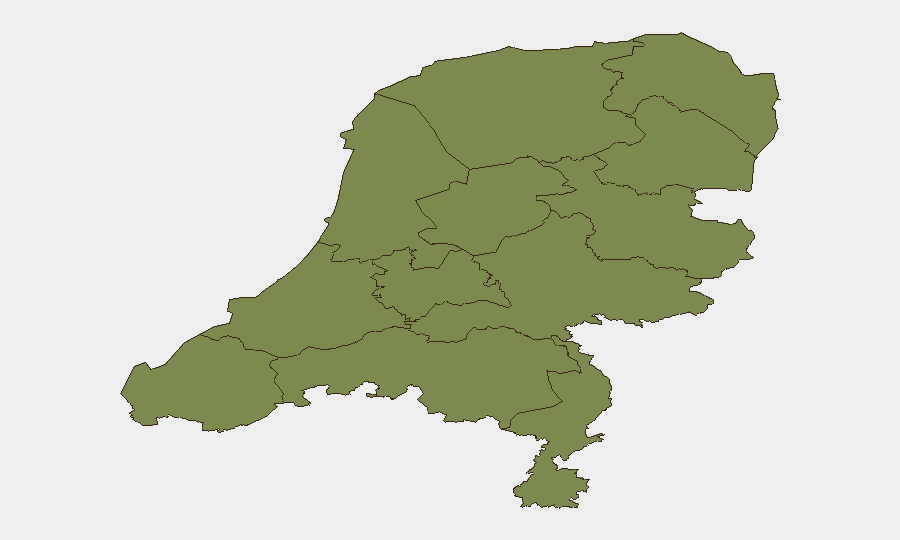
Flevoland emerges as the standout sub-national outlier with a composite risk score of 31.8—approximately three times higher than the second-ranked region (South Holland, 9.9). The basis for this elevated score is not transparent from available open-source data, and investigation into specific threat drivers (civil unrest, organized crime, infrastructure vulnerability, or external actor activity) is warranted. South Holland and North Holland follow at 9.9 and 9.2 respectively, likely reflecting urban density and port/aviation infrastructure concentration in Amsterdam, Rotterdam, and The Hague areas. All remaining provinces score below 2.5, indicating geographically dispersed baseline risk with no clustering outside the top three regions.
How GeoBit Would Assist
Security teams operating in or transiting the Netherlands should employ Intel Sweep and global event-feed monitoring to track fragmentary signals and distinguish verified incidents from noise, particularly given the current prevalence of unconfirmed Dutch and international signals. AOI Monitoring & Early Warning configured for Flevoland and the major urban centers (South and North Holland) would provide persistent watch and alerting against the elevated regional risk scores, enabling rapid escalation if incident activity crosses professional verification thresholds. OSINT fusion & corroboration tools—including X/Twitter, Telegram, and multi-language open-source search—are essential to validate the numerous public statements and investigations currently flagged without clear operational context.
7-Day Outlook
No acute escalation is forecast for the next seven days. The Netherlands should remain classified as a routine-vigilance operating environment, with security posture unchanged unless verified incidents emerge or Flevoland risk drivers become clearer. Teams should maintain baseline monitoring protocols and duty-of-care readiness, with no travel or asset-deployment restrictions warranted on current intelligence.
Highest-Risk Areas — Ranked
| # | State / Region | Risk |
|---|---|---|
| 1 | Flevoland | 31.8 |
| 2 | South Holland | 9.9 |
| 3 | North Holland | 9.2 |
| 4 | Utrecht | 2.4 |
| 5 | North Brabant | 2.4 |
| 6 | Zeeland | 1.8 |
| 7 | Frisia | 1.8 |
| 8 | Groningen | 1.8 |
| 9 | Drenthe | 1.8 |
| 10 | Gelderland | 1.8 |
| 11 | Overijssel | 1.8 |
| 12 | Limburg | 1.8 |
Sources
Previous Daily Briefs
A new Netherlands brief is written every day — each with its own risk map and downloadable CSV. Here's the last week; use the calendar to go further back.
📅 Browse every day by calendar →
Highlighted days have a brief. Tap a day for that day's map & analysis, or “csv” for that day's dataset ($5).