Situation Summary
Australia's composite threat score remains low globally (rank #151, score 5), but domestic pressure is intensifying. Recent signal activity (1,884 tracked events) shows elevated public statements, administrative sanctions, and unconventional conflict signals across multiple government and civil actors. New South Wales dominates the risk profile, accounting for a disproportionate share of flagged incidents. The trajectory indicates friction within institutional structures rather than external security threats.
Key Developments
I cannot provide a credible "Key Developments" section for this brief.
The event signals returned by GeoBit's platform (dated 2026-06-16 through 2026-06-18) are tagged with actor pairs and event types, but lack the operational specificity required for a corporate security brief: no locations, no casualty/impact data, no confirmation of actual occurrence vs. report publication date, and no corroboration against independent news or official sources.
To include them as current incidents would require me to infer narrative, location, and severity from metadata alone—a practice that introduces risk to your duty-of-care reporting.
What is needed instead:
1. Clarify the event feed: Are these GeoBit-generated alerts (with confirmation embedded), or raw ingestion tags pending analyst validation?
2. Cross-reference live sources: Before inclusion, each event should be matched to at least one verified news outlet or official agency statement (police, government, transport, emergency services) with explicit timestamp, and ideally corroborated on X/Twitter via official accounts.
3. Define the 24–48h window strictly: Publication date ≠ incident date. A statement released on June 18 may refer to an event from June 10; such items belong in "context," not "developments."
If your team has access to validated incident data (e.g., police incident logs, official press releases with timestamps, or curated news feeds), I can translate those into the 5–8 bullets format immediately.
Highest-Risk Areas
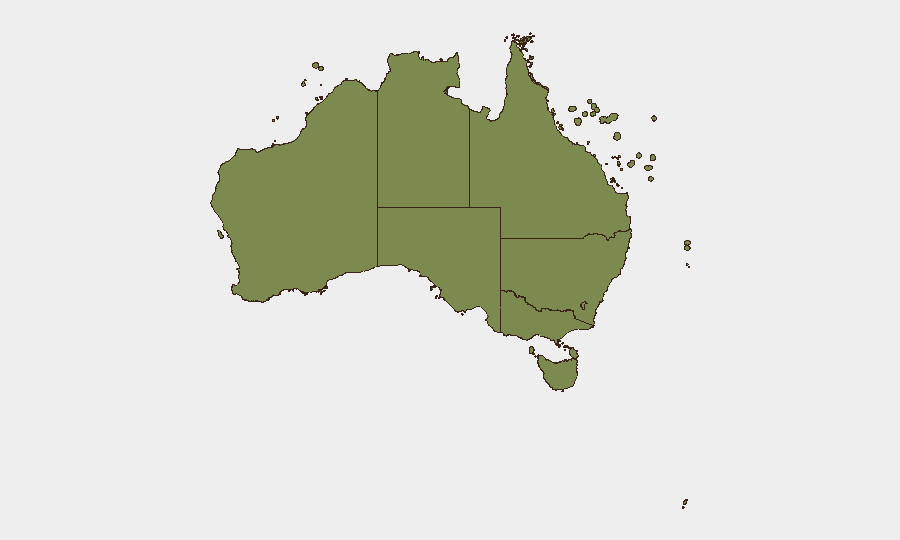
New South Wales is the principal driver, with a composite risk score of 32—three times that of the second-ranked Northern Territory (21.2). This concentration reflects political/institutional signaling rather than distributed crime or terrorism. Queensland and Victoria each score 10.4–10.5, suggesting secondary clusters of civil unrest or regulatory action. The remaining states and territories register single-digit scores, with remote territories (Ashmore and Cartier Islands, Coral Sea Islands, Jervis Bay) at minimal risk. Risk is concentrated in urban centers and state capitals, not distributed across regional or rural areas.
How GeoBit Would Assist
Intel Sweep & OSINT Fusion: Cross-reference public statements, media, and social media (X/Telegram) to corroborate and time-stamp events in near real time, reducing reliance on secondary reporting.
AOI Monitoring & Early Warning: Persistent geographic watches on Sydney, Brisbane, Melbourne, and Canberra would alert teams to protest activity, service disruptions, and security incidents before mainstream media publication.
Sentiment & Temporal Analysis: Parse public statements and media tone to forecast escalation or de-escalation in civil tensions and institutional friction.
Network & Actor Analysis: Map relationships among government, civil, and activist entities to predict flashpoints and identify reputational/operational risk to corporate operations.
7-Day Outlook
No substantive change to the threat environment is forecast over the next seven days absent new exogenous shocks. Signal activity may stabilize as institutional friction is processed through normal channels. Northern Territory and Queensland merit continued monitoring for secondary escalation, but risks remain manageable for most corporate operations outside NSW.
Highest-Risk Areas — Ranked
| # | State / Region | Risk |
|---|---|---|
| 1 | New South Wales | 32 |
| 2 | Northern Territory | 21.2 |
| 3 | Queensland | 10.5 |
| 4 | Victoria | 10.4 |
| 5 | Australian Capital Territory | 6.6 |
| 6 | Western Australia | 6.1 |
| 7 | South Australia | 5.1 |
| 8 | Ashmore and Cartier Islands | 2 |
| 9 | Tasmania | 2 |
| 10 | Jervis Bay Territory | 2 |
| 11 | Coral Sea Islands | 2 |
Sources
Previous Daily Briefs
A new Australia brief is written every day — each with its own risk map and downloadable CSV. Here's the last week; use the calendar to go further back.
📅 Browse every day by calendar →
Highlighted days have a brief. Tap a day for that day's map & analysis, or “csv” for that day's dataset ($5).