Situation Summary
Belarus remains stable but tense, with no verified major security incidents, civil unrest, or infrastructure disruptions reported in the last 24–48 hours. The country's overall threat ranking (composite score 9, #111 globally) reflects underlying structural risks—militarization, information controls, and proximity to regional conflict—rather than acute, active events. Risk concentrations remain in Minsk city and Minsk Region, driven by state security apparatus density and regional geopolitical exposure. The absence of new incident signals does not reduce underlying duty-of-care considerations for personnel and assets in-country.
Key Developments
- Minsk Region and Minsk city, June 26–27, 2026: No new discrete security incidents, protests, or large-scale crime events reported; composite risk indices remain unchanged and positioned as the highest in Belarus due to militarization and information environment, but no active triggering events in the 24–48-hour window.
- Belarus–Lithuania border airspace, June 25–27, 2026: Lithuania's extended airspace restrictions over its border with Belarus (announced June 25) continue in force; this is an ongoing aviation/UAV operational constraint, not a new incident inside Belarus proper, but affects cross-border movement and overflights.
- Nationwide, June 26–27, 2026: Multi-source security monitoring confirms no documented infrastructure disruptions, transport closures, or emergency services activations related to conflict, crime, or civil disorder in the 24–48-hour period.
- Information environment, ongoing since early June: State media and social-media controls remain in place; no new censorship escalations or blockages reported in the last 48 hours, but existing restrictions on independent reporting and cross-border communication persist as a structural risk factor.
Highest-Risk Areas
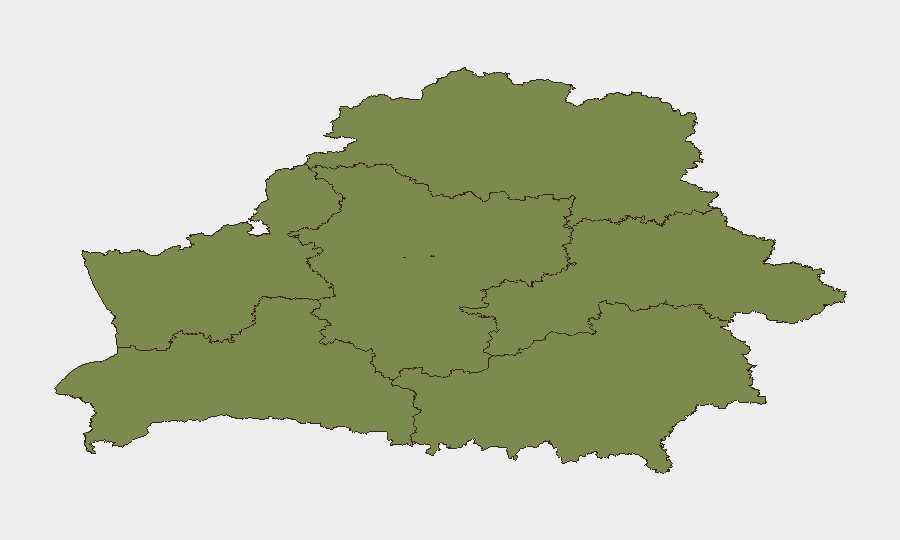
Minsk Region (composite risk 31.8) and Minsk city (19.0) account for approximately 96% of Belarus's tracked threat footprint. These zones reflect concentration of state security apparatus, heavy militarization, and proximity to Ukrainian conflict spillover and NATO border tension. Secondary regions (Brest, Vitsebsk, Hrodna, Mahilyow, Homyel) all score below 4.0, indicating substantially lower incident density and organizational threat. Organizations with personnel or critical assets should prioritize situational awareness and contingency protocols for Minsk-centric operations; field operations in secondary regions carry materially lower acute risk.
How GeoBit Would Assist
Security teams operating in Belarus should employ AOI Monitoring & Early Warning on Minsk Region and Minsk city to detect any escalation in security operations, crowd activity, or infrastructure disruption before they affect operations or personnel safety. Concurrent Intel Sweep, OSINT fusion, and multi-language social/Telegram monitoring provide real-time corroboration of state media narratives and early detection of information-environment changes that may precede operational shifts. Routing & Network Analysis supports contingency planning for personnel extraction or movement around Minsk in the event of sudden access restrictions or civil disruption; GIS & Spatial Analysis maps high-risk areas and safe zones for daily tasking decisions.
7-Day Outlook
No imminent escalation is indicated by current event signals or trend analysis. The risk environment is expected to remain stable but vigilant over the next seven days, with underlying militarization and border tension as persistent drivers rather than acute triggers. Security teams should maintain heightened monitoring of Minsk Region for any change in state activity or information environment; all other regions remain in baseline posture.
Highest-Risk Areas — Ranked
| # | State / Region | Risk |
|---|---|---|
| 1 | Minsk Region | 31.8 |
| 2 | Minsk | 19 |
| 3 | Brest Region | 3 |
| 4 | Vitsebsk Region | 1.8 |
| 5 | Hrodna Region | 1.8 |
| 6 | Mahilyow Region | 1.8 |
| 7 | Homyel Region | 1.8 |
Sources
Previous Daily Briefs
A new Belarus brief is written every day — each with its own risk map and downloadable CSV. Here's the last week; use the calendar to go further back.
📅 Browse every day by calendar →
Highlighted days have a brief. Tap a day for that day's map & analysis, or “csv” for that day's dataset ($5).