Situation Summary
Cuba is experiencing a severe infrastructure crisis and rising civil unrest, driven by repeated nationwide blackouts, fuel shortages, and sustained energy-rationing measures. Protest activity has intensified sharply in Havana and secondary cities, with demonstrations evolving from demands for electricity restoration to broader anti-government messaging. The convergence of infrastructure collapse, security-force responses to street protests, and ongoing enforced-disappearance allegations has created a compound risk environment for personnel and assets across the island, particularly in the capital.
Key Developments
- Nationwide grid collapse, July 13–14: Cuba's national electricity system underwent a second complete failure within one week, affecting most provinces and causing a blackout exceeding 33 hours in some areas. Restoration timelines remain uncertain and fuel shortages continue to constrain grid stability.
- Cacerolazo (pot-banging protest), Guanabacoa (Havana), July 13 evening: Residents in Reparto Nalón staged a concentrated protest against authorities following the extended blackout, with video evidence showing significant crowd activity and anti-government slogans in residential streets.
- Escalating street clashes, Santa Fe neighborhood (Playa district, Havana), July 10–13: Multiple nights of confrontations between demonstrators and riot police have been reported, including barricaded street fires on the Panamerican Highway and skirmishes near financial infrastructure. Accounts indicate undercover documentation of protesters for potential later targeting.
- Anti-government demonstration, Old Havana, July 11 (ongoing social amplification): A street protest featuring pot-banging and anti-government chants coincided with the July 11 protest-anniversary date. Recent social-media circulation continues to frame this as part of a broader wave of unrest.
- Rising protest frequency nationwide, June–early July: The Cuban Conflict Observatory documented 107 nationwide protests in June 2026, with 82 concentrated in Havana. Recent reporting indicates protest slogans have broadened from electricity demands to calls for "freedom" and removal of leadership.
- Disappearance of prominent dissident, Luis Manuel Otero Alcántara, July 7: The artist was removed from Guanajay prison by State Security and remains missing. Amnesty International has characterized it as a forced disappearance, and his case is now being cited in protest narratives, with a UN deadline of July 25 for Cuba to provide an official report.
- International travel and service disruptions, ongoing since February: Updated foreign advisories confirm that international flights cannot refuel in Cuba, and daily power cuts continue to disrupt water, food, ATMs, transport, and communications. Further disruptions are deemed likely on short notice.
Highest-Risk Areas
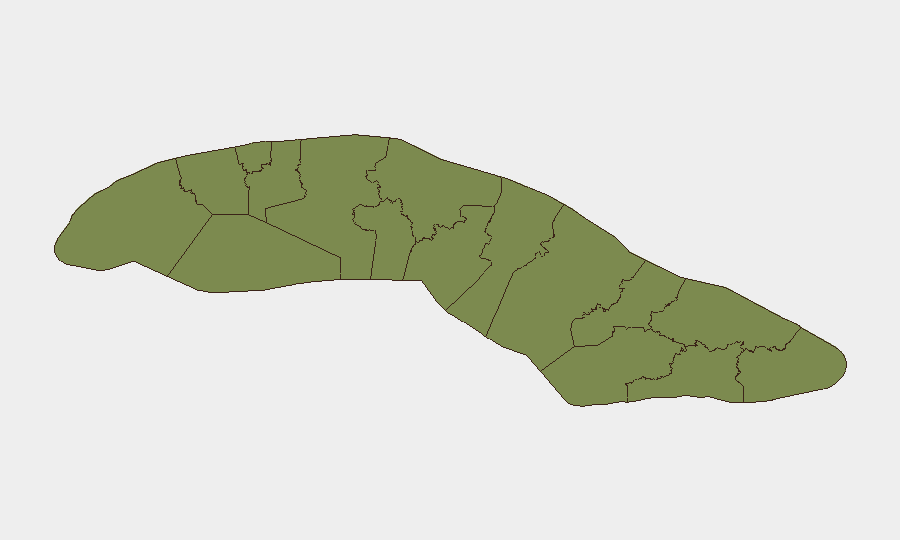
Sancti Spiritus (risk 33.9) and Havana (risk 32.8) are driving the majority of tracked risk signals. Havana's elevated score reflects concentrated protest activity across multiple neighborhoods—particularly Playa (Santa Fe, Jaimanitas, Miramar), Old Havana, and Guanabacoa—coupled with police-protest confrontations and service-infrastructure failures. Sancti Spiritus's comparable risk level suggests significant underlying unrest or security incidents in that province that warrant immediate clarification. Secondary provinces (Isle of Youth, Santiago de Cuba, Camagüey) show substantially lower but non-negligible risk, indicating broader geographic fragility.
How GeoBit Would Assist
Security teams should deploy AOI Monitoring & Early Warning to track protest hotspots in Havana and secondary cities in real time, with OSINT fusion (social media, local news, Telegram, radio SIGINT) to detect escalation patterns before they become public. GIS & Spatial Analysis can map infrastructure dependencies (power substations, fuel storage, water systems) and overlay protest activity and checkpoint locations to model travel-route risk and identify safe corridors. Network & Actor Analysis can corroborate the State Security apparatus's documented targeting of protest participants, enabling threat assessment of individuals or facilities at elevated interdiction risk.
7-Day Outlook
Protest activity is likely to intensify if grid failures persist or are announced in advance. Police responses are expected to remain forceful, with documentation of participants for later detention. Infrastructure instability will continue to constrain communications, fuel supply, and water availability, creating compounding operational friction for corporate teams and heightening the risk of secondary civil disorder linked to humanitarian hardship.
Highest-Risk Areas — Ranked
| # | State / Region | Risk |
|---|---|---|
| 1 | Sancti Spiritus | 33.9 |
| 2 | Havana | 32.8 |
| 3 | Isle of Youth | 10.6 |
| 4 | Santiago de Cuba | 9.6 |
| 5 | Camagüey | 6.7 |
| 6 | Artemisa | 6.1 |
| 7 | Matanzas | 5.5 |
| 8 | Las Tunas | 5.1 |
| 9 | Mayabeque | 4.8 |
| 10 | Pinar del Rio | 3.9 |
| 11 | Cienfuegos | 3.9 |
| 12 | Villa Clara | 3.9 |
Sources
Previous Daily Briefs
A new Cuba brief is written every day — each with its own risk map and downloadable CSV. Here's the last week; use the calendar to go further back.
📅 Browse every day by calendar →
Highlighted days have a brief. Tap a day for that day's map & analysis, or “csv” for that day's dataset ($5).
Atlas — our AI intelligence desk — emails them this snapshot personally. Nothing else, no list.