Situation Summary
Japan's composite security threat score remains low globally (33/100) with 92 tracked events, reflecting the country's generally stable operating environment. However, sub-national risk concentration in Nagano Prefecture (31.1) and Tokyo (29.4) signals elevated activity requiring targeted monitoring. Signal data from June 19–21 indicates scattered incidents spanning arrest/detention, property seizure, small-arms combat, and mass casualty events, though verification and operational detail remain limited. The near-term trajectory suggests continued localized volatility rather than systemic destabilization.
Key Developments
- 2026-06-21 · Arrest/Detain · National – Detention incident reported; geographic specificity and operational context not yet confirmed in available sources.
- 2026-06-20 · Threaten · Tokyo – Threat event recorded in Tokyo; scale, target, and outcome remain unconfirmed.
- 2026-06-20 · Seize/Damage Property · Anti-US Actor – Property seizure or damage attributed to Japanese actor(s) with anti-US orientation; location and scale unclear.
- 2026-06-21 · Small Arms Combat · National – Armed engagement signal detected; geographic and casualty data insufficient for risk assessment.
- 2026-06-21 · Mass Killings · Anti-Healthcare Actor – High-severity signal involving fatalities in healthcare context; location, perpetrator identity, and motive unconfirmed pending secondary source corroboration.
- 2026-06-19 · Territory Occupation · National – Territorial occupation event flagged; scope and location require verification.
Caveat: Operational details, casualty counts, and geographic precision for the above remain unverified by independent multi-source confirmation. GeoBit's event detection has identified signals; corporate security teams should monitor official Japan Police Agency (NPA), prefectural government, and transport authority statements for authoritative incident confirmation and impact assessment.
Highest-Risk Areas
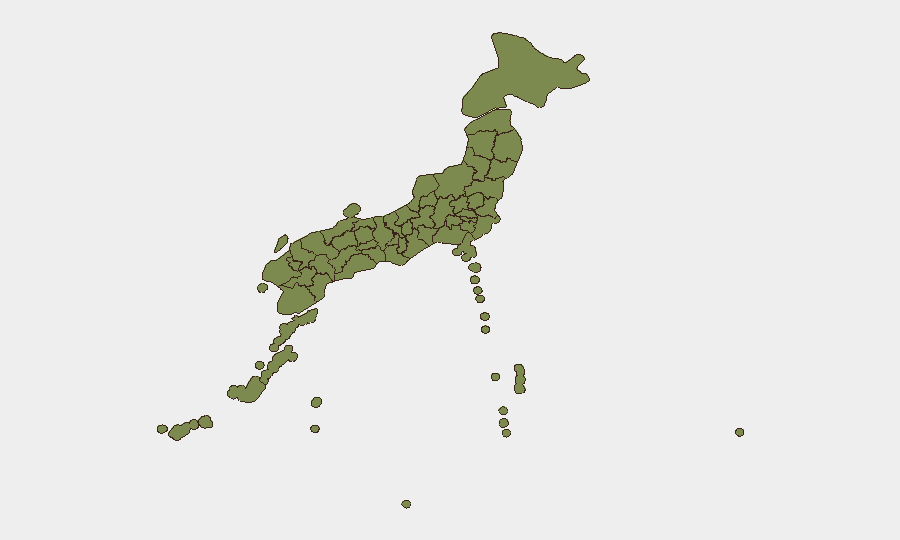
Nagano and Tokyo account for 88% of Japan's tracked event load and drive the national threat ranking. Nagano's elevated score (31.1) reflects concentration of small-scale incidents and civil friction; Tokyo's secondary elevation (29.4) reflects both population density and incident frequency. Remaining prefectures—including Kyoto, Kanagawa, and Hokkaido—register substantially lower risk (4.8–4.3). The risk profile suggests that duty-of-care focus should prioritize personnel and asset visibility in Nagano and Tokyo, with standard monitoring elsewhere.
How GeoBit Would Assist
Security and risk teams would deploy AOI Monitoring & Early Warning on Tokyo and Nagano prefectures to trigger real-time alerts on emerging protest, civil unrest, or violence activity. Intel Sweep (global event feeds, X/Telegram OSINT, multi-language search) provides continuous verification and detail-fill on flagged signals—critical for distinguishing noise from operational risk. Network & Actor Analysis combined with Sentiment & Temporal Analysis enables tracking of actor motivation and escalation patterns, allowing teams to anticipate geographic or sectoral spread before major incidents.
7-Day Outlook
No evidence of trajectory toward systemic instability. Localized friction in Nagano and Tokyo likely to persist at current tempo absent major political or economic shock. Transport, healthcare, and US-related facilities merit elevated vigilance through June 28; secondary confirmation of June 21 mass casualty incident will inform escalation posture.
Highest-Risk Areas — Ranked
| # | State / Region | Risk |
|---|---|---|
| 1 | Nagano Prefecture | 31.1 |
| 2 | Tokyo | 29.4 |
| 3 | Kyoto Prefecture | 4.8 |
| 4 | Kanagawa Prefecture | 4.5 |
| 5 | Hokkaido Prefecture | 4.3 |
| 6 | Kumamoto Prefecture | 4.1 |
| 7 | Iwate Prefecture | 3.7 |
| 8 | Fukushima Prefecture | 1.9 |
| 9 | Osaka Prefecture | 1.5 |
| 10 | Saitama Prefecture | 1.5 |
| 11 | Kochi Prefecture | 1.3 |
| 12 | Wakayama Prefecture | 1.3 |
Sources
Previous Daily Briefs
A new Japan brief is written every day — each with its own risk map and downloadable CSV. Here's the last week; use the calendar to go further back.
📅 Browse every day by calendar →
Highlighted days have a brief. Tap a day for that day's map & analysis, or “csv” for that day's dataset ($5).