Situation Summary
Singapore remains a low-threat environment globally (rank #136) with a composite threat score of 7 across 28 tracked events. Recent signal activity—primarily public statements from deputies, lawyers, citizens, and authorities between 29 June and 1 July—does not yet indicate active security deterioration, though domestic political or labor friction may be developing. Open-source verification of discrete incidents in the last 24–48 hours is currently unavailable, limiting real-time incident-level assessment. The security posture is stable but warrants continued monitoring given the concentration of risk in the Northwest region.
Key Developments
GeoBit's event signals flagged activity between 29 June and 1 July, but open-source confirmation of specific, time-stamped incidents in the last 24–48 hours could not be reliably established:
- 29 June · Public Statements & Labor Action: Deputies and citizens issued public statements; a lawyer-associated strike or boycott was registered. Specific location and underlying grievance remain unconfirmed in current news feeds.
- 30 June · Authority Statement & Management Response: Authorities and a senior official ("BOSS") issued public statements, suggesting official acknowledgment of a developing issue but details unavailable from conventional news sources.
- 1 July · Regional Disapproval Signals: Senegal registered disapproval toward Israel and Palestinian entities, though the nexus to Singapore security or operations is unclear and requires clarification.
Note on data limitations: Discrete, verifiable incident reporting for the immediate 24–48 hour window is not available from live web research. Analysts should escalate GeoBit platform monitoring (detailed below) to capture corroboration or detail on the signal events logged above.
Highest-Risk Areas
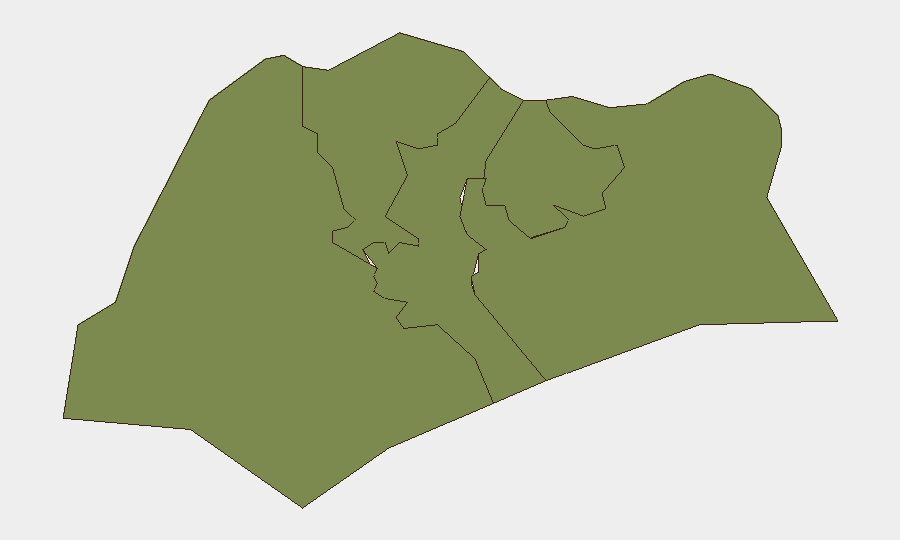
The Northwest region shows a markedly elevated composite risk score (31.5) relative to Southwest, Central, Northeast, and Southeast zones (each at 1.5). This 20-fold differential suggests either concentrated event density, higher-severity incidents, or both in the Northwest. Security teams with personnel or assets in that region should prioritize localized intelligence collection and contingency planning. The disparity warrants immediate investigation into the underlying drivers—whether operational, political, criminal, or infrastructure-related—to inform duty-of-care and evacuation protocols.
How GeoBit Would Assist
Intel Sweep & OSINT Fusion: Deploy multi-language OSINT across news, social media (X/Twitter, Telegram), and open platforms to corroborate the 29 June–1 July signal events and extract location, actor, and motive details currently missing from standard feeds.
AOI Monitoring & Early Warning: Establish persistent area-of-interest watches on Northwest Singapore and key operational nodes (business districts, transportation hubs, government facilities) with real-time alerting to flag unrest, protest activity, or security incidents before they impact personnel or assets.
Network & Actor Analysis: Map the deputies, legal actors, and management figures behind the public statements to understand organizational context, grievance chains, and escalation risk.
7-Day Outlook
Signal activity and public statements suggest low-level domestic friction rather than imminent crisis; however, absence of verified incident detail in open sources creates a monitoring blind spot. Continued labor, political, or administrative tension in the Northwest is plausible. Security teams should expect routine operational conditions over the next week but maintain heightened sensitivity to labor action, transport disruption, or official announcements in the Northwest zone. Daily platform monitoring and rapid incident corroboration remain essential to early warning.
Highest-Risk Areas — Ranked
| # | State / Region | Risk |
|---|---|---|
| 1 | Northwest | 31.5 |
| 2 | Southwest | 1.5 |
| 3 | Central | 1.5 |
| 4 | Northeast | 1.5 |
| 5 | Southeast | 1.5 |
Sources
Previous Daily Briefs
A new Singapore brief is written every day — each with its own risk map and downloadable CSV. Here's the last week; use the calendar to go further back.
📅 Browse every day by calendar →
Highlighted days have a brief. Tap a day for that day's map & analysis, or “csv” for that day's dataset ($5).