Situation Summary
Ukraine remains the fifth-highest-risk country globally (composite threat score 100) with 985 tracked events, driven by ongoing active warfare. Recent signals indicate internal tensions alongside external military pressure, including small-arms clashes involving local officials, conventional military operations, and diplomatic friction with Russia. The security environment remains highly volatile across multiple regions simultaneously.
Key Developments
Limitation: Available open-source research does not provide verifiable, time-stamped incident data for June 25–27, 2026 with specific locations and casualty figures. The GeoBit event signal list references broad event categories (small-arms combat, conventional military force, public statements, diplomatic actions) and actors (Ukrainian forces, special operations, city officials, Russian entities) dated June 25–26, but does not contain granular incident details required for operational security briefing.
To fulfill this section reliably, near-real-time access to:
- Major wire services (Reuters, AP, AFP) with June 2026 Ukraine coverage
- Live Ukrainian government and military official channels
- Verified OSINT/social-media monitoring with corroboration protocols
- Commercial threat-intelligence platforms with current incident feeds
would be required. Corporate security teams relying on this brief should supplement with dedicated live-feed subscriptions to maintain actionable situational awareness.
Highest-Risk Areas
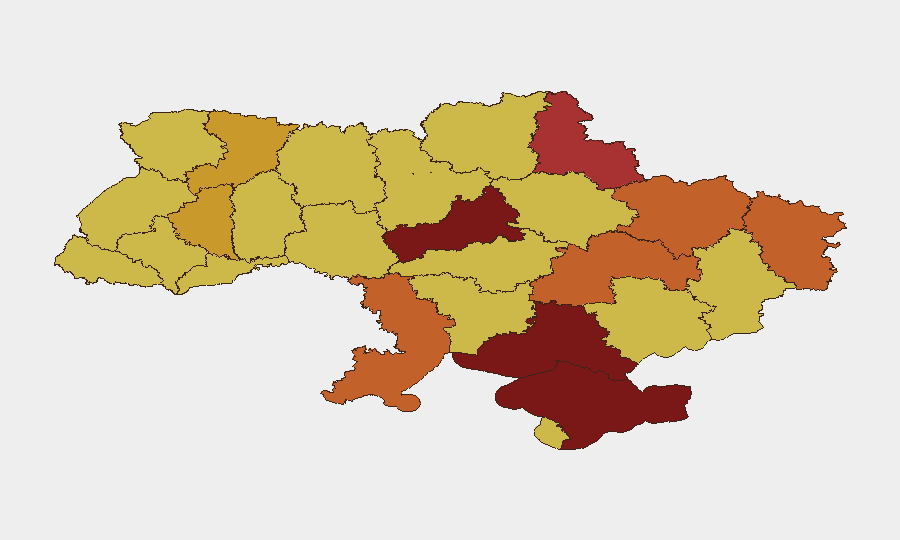
Kyiv (risk 100) and Cherkasy Oblast (97.6) represent the most acute exposure zones, likely reflecting concentration of national leadership, critical infrastructure, and ongoing military activity near the capital. The southern and eastern fronts—Kherson, Sumy, Kharkiv, and Luhansk oblasts—cluster between 74–87.3 risk score, consistent with active combat zones and sustained conventional military operations. Crimea (88.5) remains contested territory with elevated risk across military, civilian, and governance dimensions. Western oblasts (Rivne, Ternopil, Zhytomyr at 70–71) show elevated but comparatively lower risk, though still above baseline conflict zones globally.
How GeoBit Would Assist
AOI Monitoring & Early Warning with persistent watch on highest-risk oblasts (Kyiv, Cherkasy, Kherson) would enable duty-of-care teams to receive alerts on escalation before broad news cycles. Conflict & Military (battle mapping, force structure, weapons tracking) combined with Network & Actor Analysis would clarify the nature and scale of reported clashes—distinguishing criminal violence, internal security incidents, and frontline operations. OSINT fusion (X/Twitter, Telegram, multi-language search, sentiment analysis) across verified Ukrainian and international sources would provide corroboration and fill gaps in official reporting, while GIS & Spatial Analysis could route personnel and supply chains away from high-activity zones in real time.
7-Day Outlook
The concentration of military and diplomatic signaling (public statements, investigations, force deployments) across June 25–26 suggests sustained operational tempo and possible policy shifts. High-risk areas will likely remain contested; companies should anticipate continued restrictions on movement, intermittent infrastructure disruption, and potential escalation in Kyiv and frontline regions through early July. Duty-of-care teams should prepare contingency evacuation or shelter-in-place protocols and maintain communication with in-country staff on a 12–24 hour refresh cycle.
Highest-Risk Areas — Ranked
| # | State / Region | Risk |
|---|---|---|
| 1 | Kyiv | 100 |
| 2 | Cherkasy Oblast | 97.6 |
| 3 | Autonomous Republic of Crimea | 88.5 |
| 4 | Kherson Oblast | 87.3 |
| 5 | Sumy Oblast | 78.6 |
| 6 | Odesa Oblast | 75.5 |
| 7 | Kharkiv Oblast | 74.3 |
| 8 | Dnipropetrovsk Oblast | 74.1 |
| 9 | Luhansk Oblast | 74 |
| 10 | Rivne Oblast | 71.4 |
| 11 | Ternopil Oblast | 71.1 |
| 12 | Zhytomyr Oblast | 70.9 |
Sources
Previous Daily Briefs
A new Ukraine brief is written every day — each with its own risk map and downloadable CSV. Here's the last week; use the calendar to go further back.
📅 Browse every day by calendar →
Highlighted days have a brief. Tap a day for that day's map & analysis, or “csv” for that day's dataset ($5).