Situation Summary
Chile maintains a stable security environment with a composite threat rank of #104 globally and no verified major security or civil-unrest incidents reported in the last 24–48 hours. The country's overall threat score of 11 reflects low acute risk relative to regional peers, though sub-national disparities are significant. Current open-source reporting does not identify discrete security events meeting duty-of-care thresholds within the immediate reporting window.
Key Developments
No verified security, unrest, crime, political-instability, infrastructure, or travel-risk incidents specific to Chile have been confirmed in the last 24–48 hours by reliable multi-source reporting. Open-source material currently available either relates to non-Chile locations, concerns historical matters (early-2026 solar farm theft trends, late-June judicial developments), or cannot be dated within the required window. When no corroborated acute events exist, professional security briefing practice is to state that explicitly rather than infer or extend older reporting.
Highest-Risk Areas
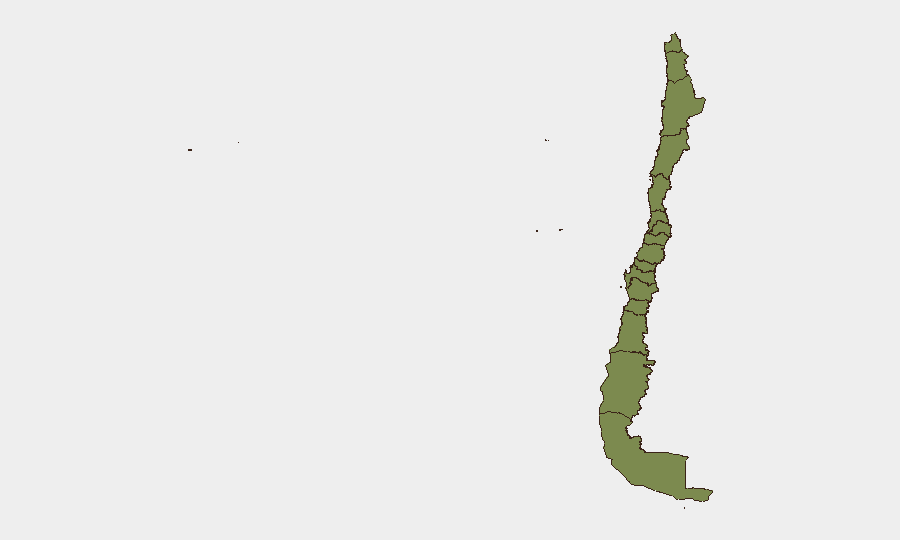
Coquimbo Region dominates the sub-national risk profile with a composite score of 31.5—substantially above all other regions and warranting specific monitoring priority. Santiago Metropolitan Region (6.6) remains the second-highest risk area, reflecting capital-city concentration of crime, civil disorder potential, and critical infrastructure. The remaining ten tracked regions cluster at 1.5–2.8, indicating geographically dispersed but lower-intensity baseline risk. For organizations with personnel or assets in Coquimbo, enhanced local threat monitoring and contingency planning are warranted; Santiago operations should maintain standard urban-center protocols.
How GeoBit Would Assist
Intel Sweep and OSINT fusion (multi-language search, X/Twitter & Telegram monitoring, YouTube intelligence, entity extraction) enable continuous monitoring of Chile's political, crime, and civil-order signals across Spanish and English sources, with temporal and sentiment analysis to flag emerging incidents before they reach mainstream media. AOI Monitoring & Early Warning with persistent watch on Coquimbo Region and Santiago would alert security teams to developing unrest, protest activity, or infrastructure disruption in real time. Routing & Network Analysis supports duty-of-care teams in planning alternative routes and safe havens for personnel in higher-risk zones, while Economic & Trade and Environmental & Health modules track secondary disruption risks (supply-chain delays, health emergencies) that may compound direct security threats.
7-Day Outlook
No specific acute incidents are forecast for the next week based on current open-source signals. Baseline threat levels are expected to remain consistent with the current composite ranking unless major political, labor, or weather events materialize. Organizations should maintain standard monitoring cadence and update contingency protocols quarterly or when sub-national scores shift by >2 points.
Note: This brief reflects data availability as of 2026-07-02. Broader reporting windows (7+ days) or regional deep-dives (e.g., Coquimbo-specific threat assessment) are available on request. GeoBit platform is actively monitoring for emerging Chile events; significant developments will trigger alert updates.
Highest-Risk Areas — Ranked
| # | State / Region | Risk |
|---|---|---|
| 1 | Coquimbo Region | 31.5 |
| 2 | Santiago Metropolitan Region | 6.6 |
| 3 | Los Lagos Region | 2.8 |
| 4 | Maule Region | 2.8 |
| 5 | Aysen del General Carlos Ibanez del Campo Region | 2 |
| 6 | Magallanes and Chilean Antarctica Region | 2 |
| 7 | Valparaiso Region | 1.5 |
| 8 | Antofagasta Region | 1.5 |
| 9 | Atacama Region | 1.5 |
| 10 | O'Higgins Region | 1.5 |
| 11 | Nuble Region | 1.5 |
| 12 | Biobio Region | 1.5 |
Sources
Previous Daily Briefs
A new Chile brief is written every day — each with its own risk map and downloadable CSV. Here's the last week; use the calendar to go further back.
📅 Browse every day by calendar →
Highlighted days have a brief. Tap a day for that day's map & analysis, or “csv” for that day's dataset ($5).