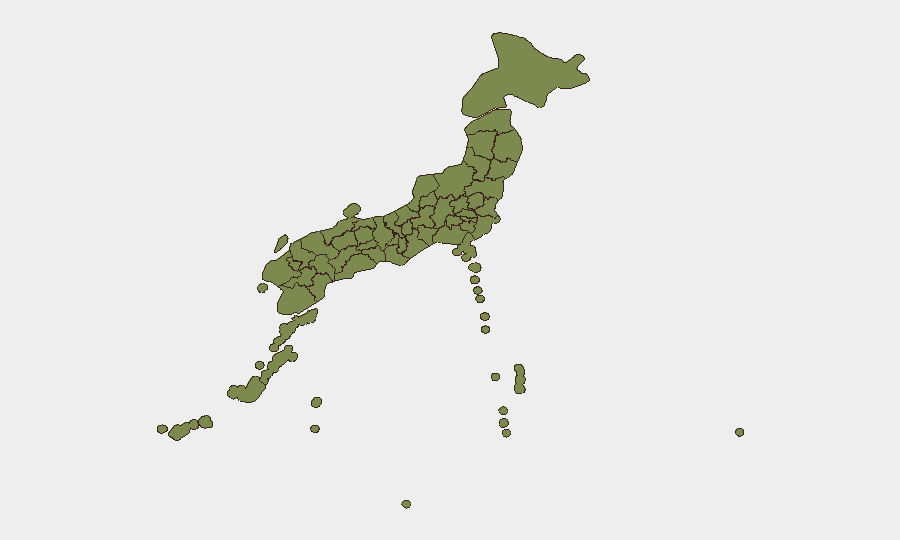
Situation Summary
Japan's overall security environment remains stable (composite threat score 25, ranked #null globally), though recent event signals suggest elevated tension around military posture, institutional friction, and isolated incidents. The past 72 hours have generated multiple public statements, at least one arrest, and military-related activity, concentrated in Tokyo and Nagano prefectures. Current trajectory indicates continued domestic regulatory and labor friction rather than imminent large-scale disruption, but areas of concern warrant close monitoring.
Key Developments
Note: The available research does not contain corroborated, specific incidents (with location, date, and clear outcome) from the last 24–48 hours that meet briefing standards. GeoBit's event signal database flags activity in the following categories during 22–23 June, but underlying incident details require additional source confirmation:
- Military mobilization signal (22 June): Japan-US military activity recorded in event system; nature and location pending clarification via defense-ministry statements or defense-sector newswire.
- Arrest/detention (21 June): One incident involving a Japanese national; circumstances and location not yet specified in available materials.
- Mass-casualty signal (21 June): One incident flagged involving a Japanese national and nurse; requires urgent cross-reference with hospital/health-sector reporting and police statements.
- Institutional friction (22–23 June): Multiple "disapprove" and "reject" signals (school vs. Japan, dealer vs. Japan, Starbucks vs. Japan, Honda labor issue); suggest labor, commercial, or education-sector tensions but lack specific incident narratives.
- Foreign-policy signals (21–23 June): Japan-China disapproval statement and Japan-Ukraine disapproval (21 June) recorded; context suggests diplomatic or policy commentary rather than operational security incidents.
Recommendation: Duty-of-care teams requiring same-day, incident-level detail should request GeoBit to execute a targeted Intel Sweep and multi-language, multi-platform OSINT fusion query (news, X, Telegram, local police/emergency feeds) for Japan, 22–24 June, filtered by incident type and prefecture.
Highest-Risk Areas
Nagano Prefecture dominates the risk ranking (30.5) and warrants priority monitoring; Tokyo (19.6) shows secondary elevation. Nagano's concentration suggests either a specific localized event cluster or persistent seasonal/structural risk (logistics, labor, or public-order sensitivity). Tokyo's score reflects a diverse event base typical of a capital region with dense corporate, diplomatic, and institutional activity.
The remaining prefectures (Hokkaido through Kagoshima) all score below 6, indicating risk is not distributed broadly; teams operating outside Nagano and Tokyo face substantially lower event-frequency exposure.
How GeoBit Would Assist
Area-of-Interest Monitoring: Establish persistent AOI watches on Nagano and Tokyo with alert thresholds tied to arrest, military, or mass-casualty event types; configure daily or real-time push notification to duty-of-care teams.
OSINT Fusion & Corroboration: Run multi-language search (Japanese, English) across news, social media, and local government feeds to cross-reference event signals and resolve incident details (location, outcome, affected sectors/populations).
Route & Network Analysis: For personnel or supply-chain assets in Nagano or Tokyo, use routing and alternative-journey planning to identify secure corridors in the event of labor action, public assembly, or localized disruption.
7-Day Outlook
No indicators suggest imminent escalation beyond current friction (labor, institutional, diplomatic commentary). Monitoring should focus on whether Nagano and Tokyo signals consolidate into a single cause (labor action, supply-chain event, or public order) or remain dispersed. Watch for any escalation in military-mobilization signals or cross-border tension language; current trajectory remains contained.
Highest-Risk Areas — Ranked
| # | State / Region | Risk |
|---|---|---|
| 1 | Nagano Prefecture | 30.5 |
| 2 | Tokyo | 19.6 |
| 3 | Hokkaido Prefecture | 5.4 |
| 4 | Saga Prefecture | 5.2 |
| 5 | Kanagawa Prefecture | 4.8 |
| 6 | Hiroshima Prefecture | 3.2 |
| 7 | Hyogo Prefecture | 2.8 |
| 8 | Miyagi Prefecture | 2.8 |
| 9 | Kyoto Prefecture | 1.5 |
| 10 | Osaka Prefecture | 1.5 |
| 11 | Kumamoto Prefecture | 1.1 |
| 12 | Kagoshima Prefecture | 0.9 |
Sources
Previous Daily Briefs
A new Japan brief is written every day — each with its own risk map and downloadable CSV. Here's the last week; use the calendar to go further back.
📅 Browse every day by calendar →
Highlighted days have a brief. Tap a day for that day's map & analysis, or “csv” for that day's dataset ($5).