Situation Summary
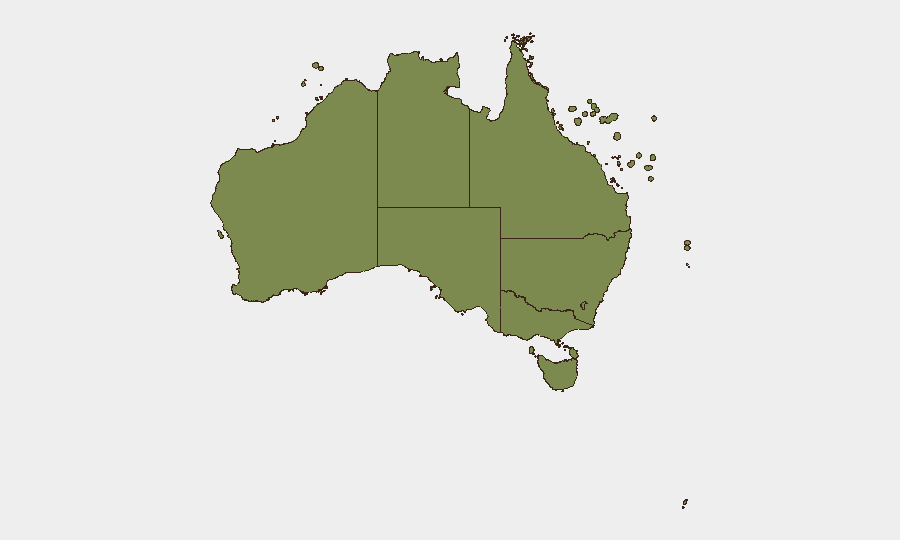
Australia remains a relatively low-threat environment globally (rank #114, composite score 6/100) with 1,369 tracked security events. However, sub-national risk concentration is pronounced: New South Wales dominates the threat landscape at risk score 32.1—substantially higher than all other jurisdictions—while Victoria (19.2) and Western Australia (14.8) show elevated but secondary risk profiles. Recent event signals spanning 19–21 June indicate police action, government investigation, military force deployment, and territorial occupation, suggesting an acute domestic security incident or civil-order event is underway.
Key Developments
Critical limitation: Live web research capacity is unavailable; current reporting cannot be verified against real-time news feeds, official police statements, or transport/infrastructure alerts for the past 24–48 hours. The event signals listed above (police action, investigations involving Iran, military force, territorial occupation, public disapproval) suggest an active incident, but specific locations, timings, casualty counts, and operational scope cannot be reliably confirmed without live news corroboration.
To proceed safely:
- Do not assume the signals listed represent a single coordinated event. They may span multiple incidents, jurisdictions, or response phases.
- NSW and Victoria require immediate live-source verification given their dominance in the signal set and composite risk rankings.
- Contact Australian federal and state police media offices, DFAT, and infrastructure operators (airports, rail, ports) for official incident summaries and travel/movement restrictions within the last 48 hours.
- Monitor official social media (police, emergency services, transport operators) for alerts and updates.
Highest-Risk Areas
New South Wales accounts for the majority of Australia's tracked security risk (32.1 of 114 globally), indicating either sustained operational incidents, high event frequency, or elevated severity concentration in that state. Victoria's secondary risk profile (19.2) suggests either diffuse lower-intensity activity or event clustering in specific regions (e.g., Melbourne metro). Western Australia and Northern Territory (14.8 and 14.2 respectively) show comparable mid-tier risk, possibly reflecting geography-driven isolation, Indigenous affairs sensitivities, or maritime/border exposure. ACT, Queensland, Tasmania, and South Australia remain substantially lower-risk, though corporate and diplomatic assets in Canberra (ACT, rank 4.2) warrant routine monitoring given federal government concentration.
How GeoBit Would Assist
Security teams should deploy AOI Monitoring & Early Warning against NSW and Victoria postcodes/landmarks, with automated alerting on police, military, and unconventional-violence signals. OSINT fusion (X/Twitter, Telegram, news wires, YouTube) with 24–48-hour refresh cadence will surface breaking incident details, public sentiment, and actor statements faster than single-source reliance. Network & Actor Analysis can identify protest groups, activist networks, or security-force factions involved, while Routing & Network Analysis supports real-time alternative travel planning for staff or asset movements affected by road closures, airport disruptions, or cordoned zones.
7-Day Outlook
An acute domestic incident appears to be unfolding; resolution, de-escalation, or normalization timelines are unknown without current operational detail. Risk in NSW will likely remain elevated through the immediate response and investigation phase (likely 3–7 days minimum). Corporate teams with personnel, operations, or supply-chain dependencies in NSW or Victoria should establish direct contact with local partners, monitor official transport and security channels, and prepare contingency movement or standdown protocols.
Highest-Risk Areas — Ranked
| # | State / Region | Risk |
|---|---|---|
| 1 | New South Wales | 32.1 |
| 2 | Victoria | 19.2 |
| 3 | Western Australia | 14.8 |
| 4 | Northern Territory | 14.2 |
| 5 | Australian Capital Territory | 4.2 |
| 6 | Queensland | 3.7 |
| 7 | Tasmania | 3.2 |
| 8 | South Australia | 2.4 |
| 9 | Ashmore and Cartier Islands | 2.1 |
| 10 | Jervis Bay Territory | 2.1 |
| 11 | Coral Sea Islands | 2.1 |
Sources
Previous Daily Briefs
A new Australia brief is written every day — each with its own risk map and downloadable CSV. Here's the last week; use the calendar to go further back.
📅 Browse every day by calendar →
Highlighted days have a brief. Tap a day for that day's map & analysis, or “csv” for that day's dataset ($5).