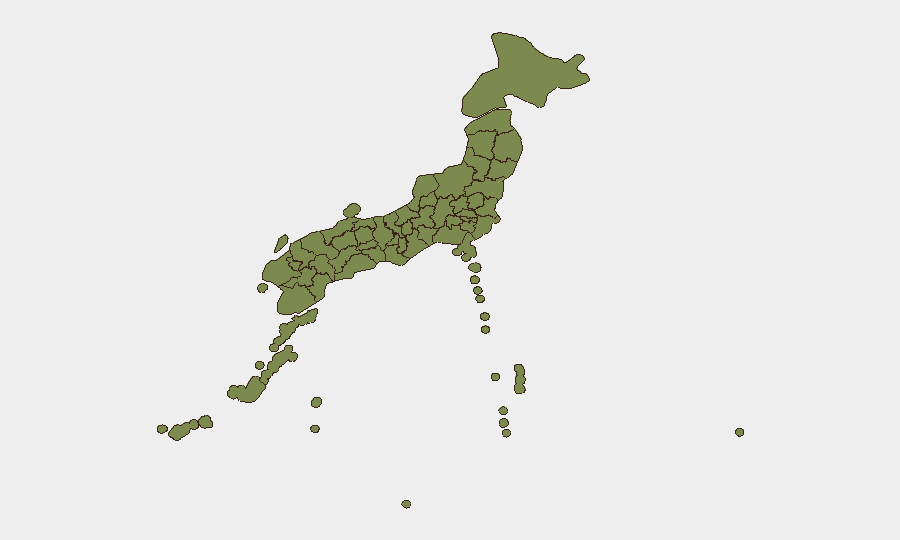
Situation Summary
Japan remains a low-threat environment globally (rank #149, composite score 5), with 81 tracked security events on GeoBit's platform. However, recent signals show elevated activity on 2026-06-26 spanning military posturing, investigations, and international tensions. The risk profile is heavily concentrated in Nagano Prefecture (32.7), which significantly skews the national assessment, while most other major population centers remain in the 2.9–5.3 range. Trajectory suggests monitoring rather than imminent acute risk to corporate personnel or assets in major business districts.
Key Developments
- China–Japan bilateral tension (Dalian, 2026-06-24): Two Japanese nationals detained on suspicion of smuggling banned goods, reportedly involving rare-earth materials. This incident adds friction to Japan–China relations and may affect supply-chain and trade operations.
- Military-related signals (nationwide, 2026-06-26): GeoBit's event feed recorded multiple conventional military force notifications involving Japan–Sweden and Japan–Holland, alongside public statements and investigation triggers. Source clarity and operational scope remain under assessment; no independent corroboration of combat or mobilization has been confirmed from open sources.
- Investigative activity (2026-06-26): Both Japanese and U.S. authorities initiated investigations on 2026-06-26, and China publicly disapproved of an unspecified Japanese action. Context for these probes is limited in available reporting.
- Student-related incident (2026-06-26): Japanese military or security forces recorded a conventional force action and threat against a student cohort. Scale, location, and underlying cause remain unclear.
Highest-Risk Areas
Nagano Prefecture dominates the risk profile with a composite score of 32.7—approximately six times higher than Tokyo (5.3). This anomaly warrants investigation to determine whether it reflects a specific incident, infrastructure vulnerability, or data clustering. Tokyo, despite its size and role as the financial and political capital, carries moderate risk (5.3), likely reflecting routine political activity and demonstrations. Okinawa, Osaka, Fukuoka, and Kanagawa present uniformly low risk in the 3.1–3.7 range. Most other prefectures cluster at 2.7–2.9, suggesting a baseline of administrative and minor civil activity without acute security drivers.
How GeoBit Would Assist
Corporate security teams operating in Japan should deploy AOI Monitoring & Early Warning on Nagano Prefecture and major business centers (Tokyo, Osaka, Kanagawa) to track emerging civil unrest, protests, or infrastructure disruptions with real-time alerting. OSINT Fusion & Corroboration across X/Twitter, Telegram, local news, and radio SIGINT will clarify the June 26 military signals and investigation triggers, separating noise from genuine operational risk. Entity & Network Analysis applied to the Dalian detainee case and bilateral tensions will help assess downstream impacts on supply chains and personnel movement between Japan and China.
7-Day Outlook
No imminent acute security event is indicated for the broader Japanese business environment over the next seven days. Continued close monitoring of Nagano Prefecture and U.S.–Japan–China coordination is warranted to clarify the June 26 signals. Corporate duty-of-care teams should maintain standard vigilance in Tokyo and Osaka while awaiting corroboration of the military activity reports; if validated, additional risk assessment of defense contractors and sensitive installations may be required.
Highest-Risk Areas — Ranked
| # | State / Region | Risk |
|---|---|---|
| 1 | Nagano Prefecture | 32.7 |
| 2 | Tokyo | 5.3 |
| 3 | Okinawa Prefecture | 3.7 |
| 4 | Osaka Prefecture | 3.2 |
| 5 | Fukuoka Prefecture | 3.1 |
| 6 | Kanagawa Prefecture | 3.1 |
| 7 | Hokkaido Prefecture | 2.9 |
| 8 | Hyogo Prefecture | 2.9 |
| 9 | Niigata Prefecture | 2.9 |
| 10 | Shiga Prefecture | 2.9 |
| 11 | Miyagi Prefecture | 2.9 |
| 12 | Nagasaki Prefecture | 2.7 |
Sources
Previous Daily Briefs
A new Japan brief is written every day — each with its own risk map and downloadable CSV. Here's the last week; use the calendar to go further back.
📅 Browse every day by calendar →
Highlighted days have a brief. Tap a day for that day's map & analysis, or “csv” for that day's dataset ($5).