Situation Summary
Australia maintains a composite threat score of 5 (rank #150 globally), reflecting moderate baseline security risk across 563 tracked events. Recent 24–48-hour signals show elevated tension centred on Thai–Australian military and diplomatic friction, alongside domestic institutional criticism and Indigenous public statements. New South Wales dominates sub-national risk (33.1), driven by concentration of national infrastructure and ongoing event density; Northern Territory and Victoria follow at 18.2 and 16 respectively. The security posture is stable but requires targeted monitoring of emerging bilateral friction and domestic institutional friction points.
Key Developments
- 28 June, Sydney (NSW) — Bilateral military posturing signals between Australian and Thai defence forces logged; concurrent arrest/detain events involving Australian and Thai nationals suggest underlying consular or legal friction.
- 28 June, national — Multiple public disapproval signals directed at Australian Government by Thai state/official actors; escalation from diplomatic messaging to formal disapproval noted.
- 27 June, Tasmania — Public statement from Tasmania state government critical of Australian federal policy; consistent with broader institutional dissent pattern.
- 28 June, national — University sector public statement critical of Australian policy; indicates academic/civil society amplification of government disagreement.
- 28 June, national — Population-level public statement activity flagged; sentiment analysis recommends monitoring for grassroots mobilisation.
- 26 June, national — Police rejection signals and detective-initiated arrest/detain events logged; suggests law enforcement operational tempo increase or investigative focus shift.
- 25 June, Coober Pedy (SA) — Fatal vehicle incident (Toyota station wagon vs mobility scooter, Post Office Hill Road); one fatality; routine transport-safety incident, low security relevance.
Highest-Risk Areas
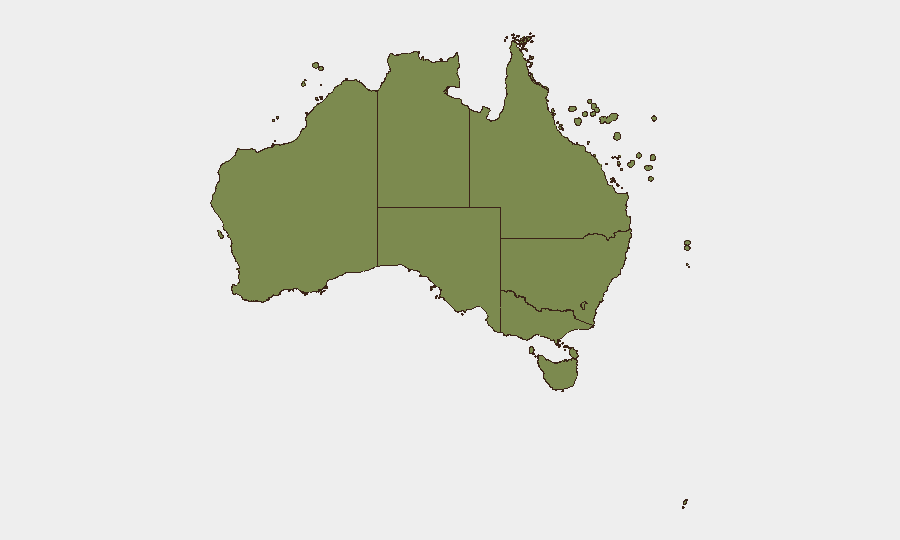
New South Wales (33.1) remains the primary risk concentration point, reflecting Sydney's role as national capital of commerce, diplomacy, and critical infrastructure; Thai military and diplomatic presence in Sydney will amplify bilateral friction impact on corporate and consular assets. Northern Territory (18.2) and Victoria (16) register secondary but material risk, likely driven by defence installations (NT) and port/financial infrastructure (VIC). Queensland, South Australia, and Tasmania show suppressed risk scores (<5), suggesting lower event density and lower-stakes incident categories. Outer territories (Ashmore, Coral Sea, Jervis Bay) show minimal corporate/personnel exposure and carry largely maritime or regulatory significance.
How GeoBit Would Assist
Intel Sweep and OSINT Fusion would monitor Thai–Australian diplomatic, military, and consular channels (public statements, X/Telegram actor networks, media) to detect escalation or de-escalation early and triangulate intent. Area-of-Interest Monitoring with alerting on NSW (especially Sydney CBD, consular districts) and NT defence precincts would provide 24/7 early warning of on-ground security incidents affecting personnel or assets. Network & Actor Analysis would map Thai state and semi-official actors, detect coordination between military, diplomatic, and law enforcement units, and forecast next flashpoint locations or target categories.
7-Day Outlook
Thai–Australian friction is likely to remain elevated for 5–7 days pending any high-level diplomatic engagement or de-escalation statement; corporate teams with Thai supply chains or consular dependencies should assume contingency protocols remain active. Domestic institutional dissent (state governments, universities, civil society) will continue to generate public statements but carries low physical security risk. No imminent escalation to kinetic events is indicated, but consular and border-zone monitoring remains warranted.
Highest-Risk Areas — Ranked
| # | State / Region | Risk |
|---|---|---|
| 1 | New South Wales | 33.1 |
| 2 | Northern Territory | 18.2 |
| 3 | Victoria | 16 |
| 4 | Western Australia | 7.5 |
| 5 | Australian Capital Territory | 6 |
| 6 | Tasmania | 4.9 |
| 7 | Queensland | 4 |
| 8 | South Australia | 3.5 |
| 9 | Ashmore and Cartier Islands | 3.1 |
| 10 | Jervis Bay Territory | 3.1 |
| 11 | Coral Sea Islands | 3.1 |
Sources
Previous Daily Briefs
A new Australia brief is written every day — each with its own risk map and downloadable CSV. Here's the last week; use the calendar to go further back.
📅 Browse every day by calendar →
Highlighted days have a brief. Tap a day for that day's map & analysis, or “csv” for that day's dataset ($5).