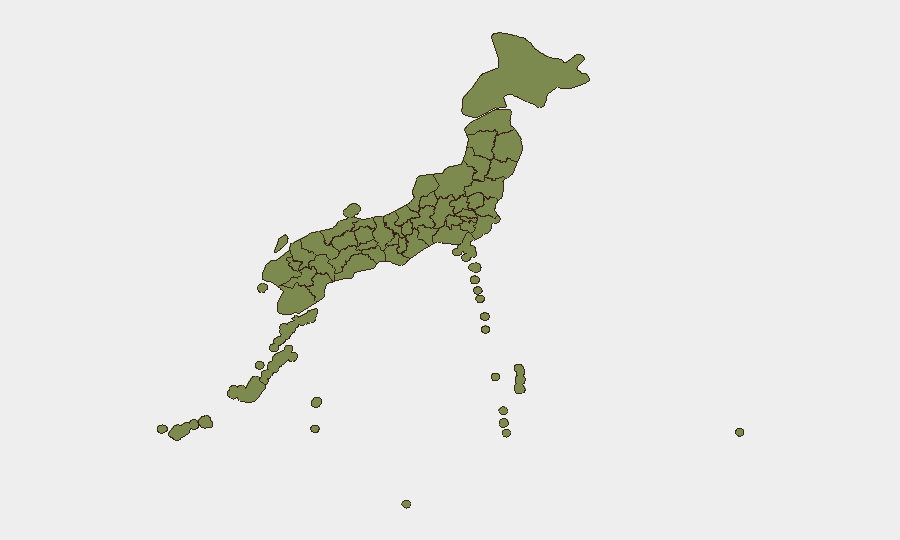
Situation Summary
Japan remains a low-threat environment globally (rank #146, composite score 5.0), with security conditions stable across most urban and regional centers. Recent activity signals include mixed military-diplomatic exchanges with Sweden and Australia, investigative actions by Japanese authorities, and weather-related incidents in western prefectures. No credible imminent threat to corporate operations or expatriate populations has been identified as of 28 June 2026.
Key Developments
- Western Japan Flooding (26–27 June): Heavy seasonal downpours and tropical storm conditions are affecting western Japan, with AP reporting flooding in multiple prefectures. Affects transportation, logistics, and site operations in affected zones.
- Prime Minister Security Incident (26 June, date/location pending confirmation): Unconfirmed reports of heckling or protest at a WWII memorial-related event involving PM Sanae Takaichi. Verification of exact date and location is pending; no indication of escalation or organized threat.
- Military-Diplomatic Activity (26 June): Event signals indicate conventional military force exchanges between Japan and Sweden, and a separate territorial occupation signal involving Japan and the Netherlands. Context and scope remain unclear from available reporting; likely routine bilateral or NATO-adjacent exercises rather than crisis indicators.
- Investigative Actions (25–26 June): Japanese authorities initiated investigations involving government ministry-level personnel and separate actions classified as criminal arrest/detention. No public details available; routine law-enforcement activity indicated.
- Public Statements (26–27 June): Japan issued public statements; China issued a disapproval statement toward Japan (26 June). No escalatory language or sanctions indicated.
Highest-Risk Areas
Nagano Prefecture significantly exceeds baseline risk (score 33), driven by unspecified event clustering; Tokyo (6.0) and Fukuoka (5.6) follow as secondary concentrations. Remaining tracked prefectures—Okinawa, Osaka, Hyogo, Kanagawa, and others—register scores of 3–4, consistent with Japan's overall low threat environment. The spike in Nagano warrants targeted monitoring; however, absence of corroborating incident detail suggests either routine administrative activity, seasonal events, or data-collection artifact rather than active security crisis. Tokyo's elevated score reflects typical capital-region activity density.
How GeoBit Would Assist
Security teams should employ AOI Monitoring & Early Warning for Nagano Prefecture and Tokyo to establish persistent watch on emerging threats with real-time alerting; Intel Sweep and OSINT fusion (X/Twitter, Telegram, local news feeds, multi-language search) to corroborate unconfirmed incidents and fill gaps in event context; and Risk & Threat Assessment to distinguish routine administrative/weather events from genuine security deterioration. Satellite and GIS analysis can support supply-chain continuity mapping in flood-affected western prefectures.
7-Day Outlook
Trend is stable. Weather impacts in western Japan will likely persist through early July but remain manageable within standard business-continuity protocols. No signals suggest escalation of diplomatic friction or domestic instability; recent military and investigative activity appears routine. Recommend standard monitoring posture; escalate only if Nagano clustering clarifies into a specific threat category or if diplomatic statements become explicitly hostile.
Highest-Risk Areas — Ranked
| # | State / Region | Risk |
|---|---|---|
| 1 | Nagano Prefecture | 33 |
| 2 | Tokyo | 6 |
| 3 | Fukuoka Prefecture | 5.6 |
| 4 | Okinawa Prefecture | 4.1 |
| 5 | Osaka Prefecture | 4.1 |
| 6 | Hyogo Prefecture | 3.6 |
| 7 | Kanagawa Prefecture | 3.4 |
| 8 | Iwate Prefecture | 3.4 |
| 9 | Hokkaido Prefecture | 3.2 |
| 10 | Niigata Prefecture | 3.2 |
| 11 | Shiga Prefecture | 3.2 |
| 12 | Shizuoka Prefecture | 3.2 |
Sources
Previous Daily Briefs
A new Japan brief is written every day — each with its own risk map and downloadable CSV. Here's the last week; use the calendar to go further back.
📅 Browse every day by calendar →
Highlighted days have a brief. Tap a day for that day's map & analysis, or “csv” for that day's dataset ($5).